Exploring Work Item Charting in Team Foundation Server 2013
With today’s announcement of Team Foundation Server 2013 Release Candidate, I thought I would quickly take a look at the new feature “Work Item Charting” that is enabled in this release and has shipped out on Team Foundation Service.
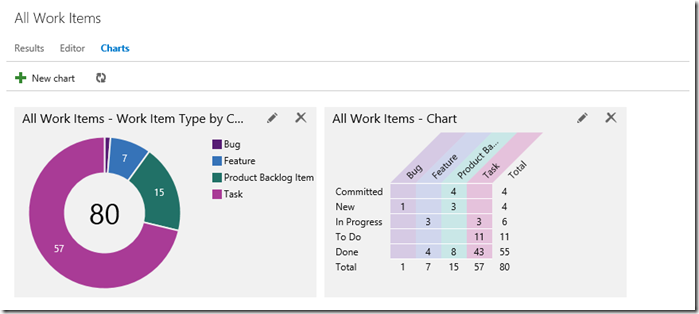
Work Item Charting allows you to use a browser based interface to create visual chart representations of the data returned from a TFS query. This allows us to build up a view of visual representations of work item data that help us understand the state of our projects better in a simple to use way.
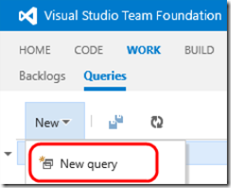
To get started with our charting the first thing you need is to use the connect to your TFS project via web access and head to the Work Items section and add a new Work Item Query:
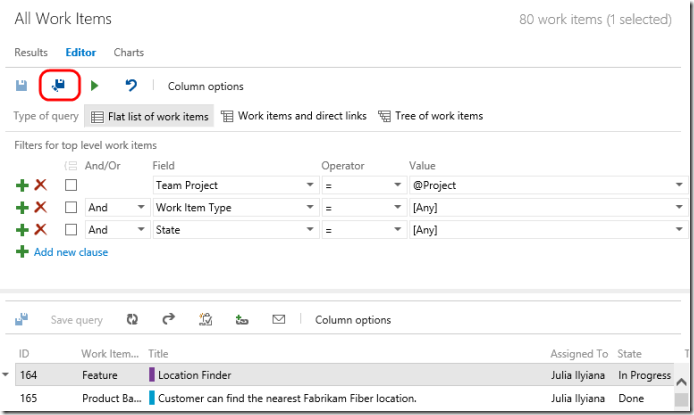
In my example I have the simplest of queries (the default), of course you can modify this query to mine out the work item data-set that you want to work with:
In my instance I will leave the default query in place and add no additional clauses. This query by default returns me all the work items in my project (denoted by the @Project syntax) that are of [Any] Work Item Type (Features, PBIs, Tasks, Bugs etc...) and are in [Any] State (New, In Progress, Done etc...). With this simple query in place I can simply save my query using the “Save As…” icon to give my new query a sensible name like “All Work Items”.
Now I have my query you can see in the above diagram (albeit truncated) that a result set is returned based on the query. This now provides us with the basis from which we can start “Work Item Charting” by moving to the “Charts” tab and selecting “New Chart”:
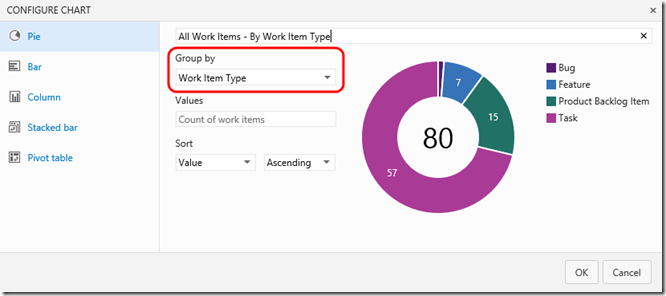
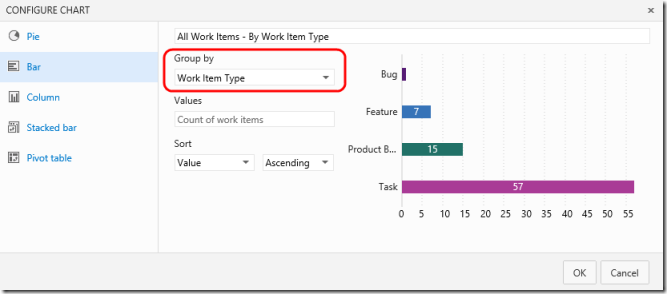
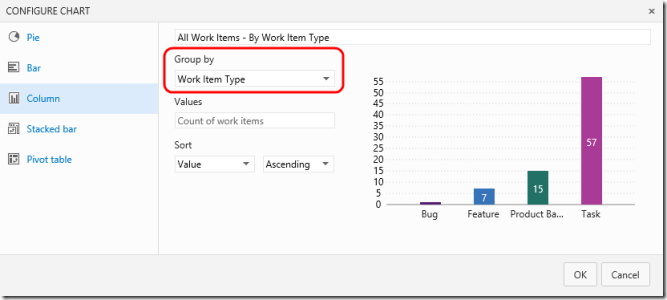
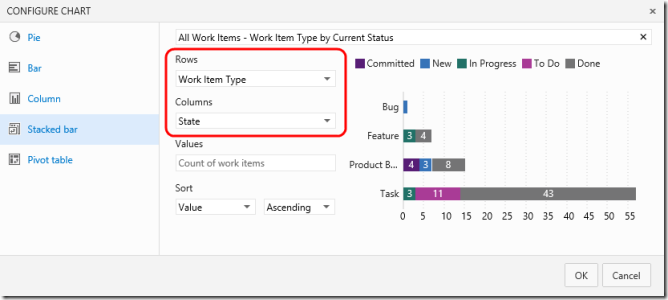
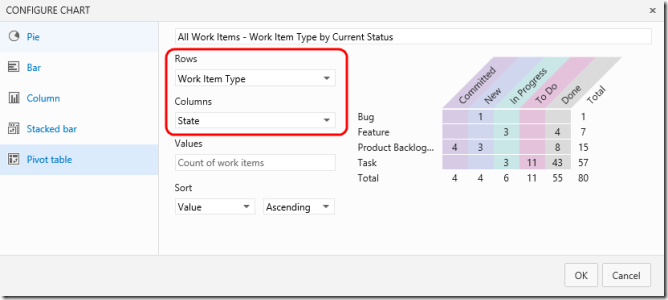
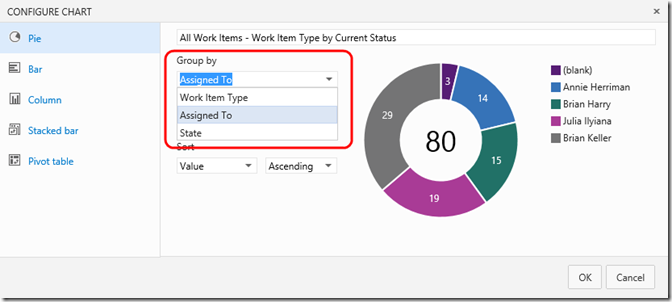
For our new chart we have several choices of types of chart (Pie, Bar, Column, Stacked Bar and Pivot Table). Each type of chart you can name appropriately, select the “Group By” value and choose your sort order.
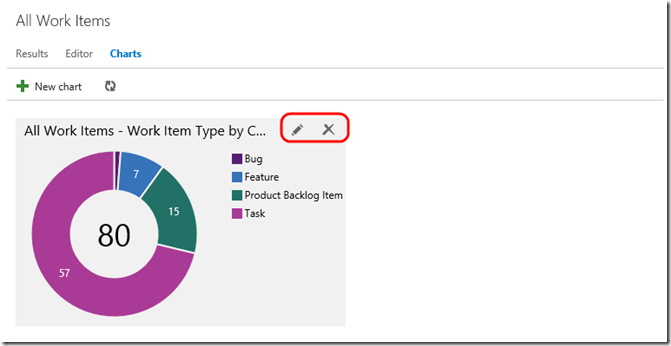
For Pie Charts (shown above), Bar Charts and Column Charts (shown below) you only have to specify a single field as the value for “Group By” to get up and running.
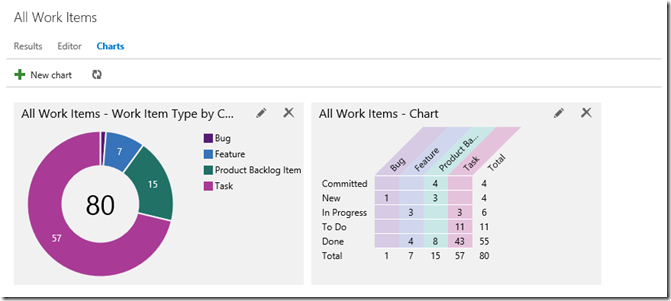
To facilitate the creation of stacked bar charts and pivot charts (shown below) two data fields are required. With these input you can easily create these charts also:
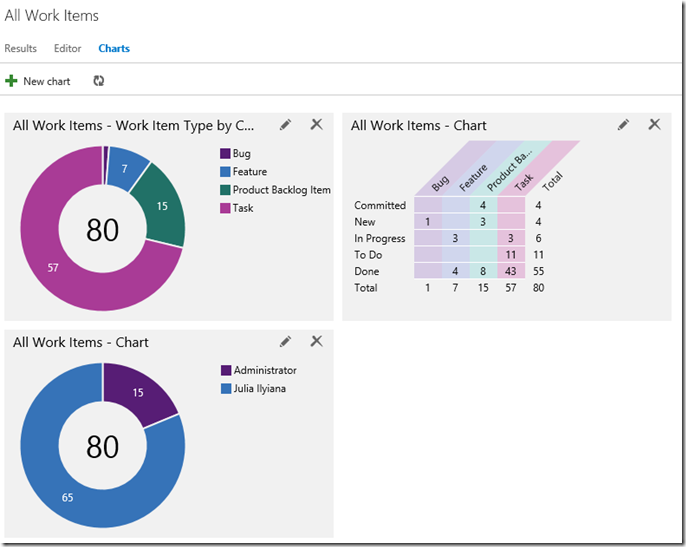
When you have selected the options for your chart and clicked “OK" the chart is displayed in the Charts section. This view you can come back to at a later time. Note you can go back an edit options in an existing chart or delete it from the view with the options in the top right corner of the chart.
Of course additional charts can be added to the view using the “New chart” button. This allows the dataset to be sliced several ways in a single place.
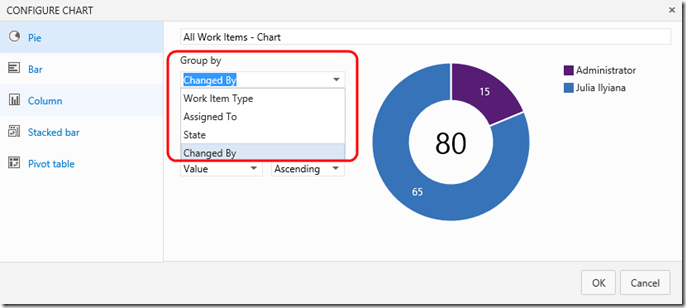
More advanced usage of the charting functionality involves adding to the fields allowable for selection in the “Group by”, “Rows” and “Column” fields used by the charts. In my example I start with only three selectable options for a “Group by” clause.
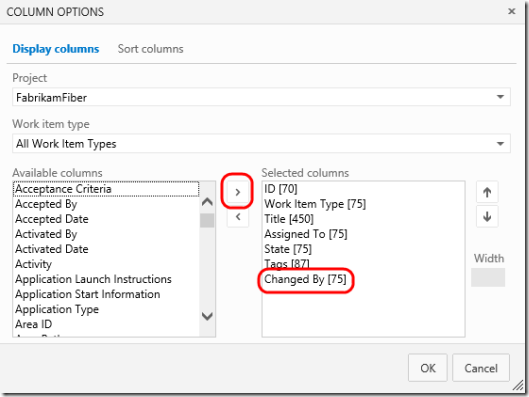
If I go back to my query in the editor that defines the data used for my charts and select “Column options” it will enable me to specify further fields that I can work with by adding them as columns to my query.
In the column options dialog I simply need to select from the “Available columns” the field that I want to be returned in my query dataset and move it to the right hand “Selected columns” section as I have done below adding the “Changed By” field.
If I look at the data returned for my query now I can see the newly added “Changed By” field is returning data that I can now incorporate into my charts.
With this data in place for my query I now can create a new chart (or modify an existing one) and it will incorporate the new field as a selectable value.
With this in place we can add a diverse amount of data onto our Charts view via a number of charts. In my example shown here the data I have returned from the query is quite simple but the “Work Item Charting” feature will work on any flat query that you add to TFS. If you want further detail of how to work with the TFS work item query engine to get further data please see the online reference on MSDN (https://msdn.microsoft.com/en-us/library/vstudio/dd286638.aspx).
Hope you like the feature!
Colin.
