Visual Studio 2012 Page Inspector
The new Page Inspector in Visual Studio 2012 really helps with a common problem – where does something I can see in my web application’s UI actually come from? Where in my source code will I need to look?
Page Inspector provides integrated browser diagnostic tools that allow you to see where UI elements are derived from the underlying source code.
Let’s look at a very simple example. I created a new Project using the ASP.NET MVC 4 Project Template (but any will do, use one of your existing projects to try this out).
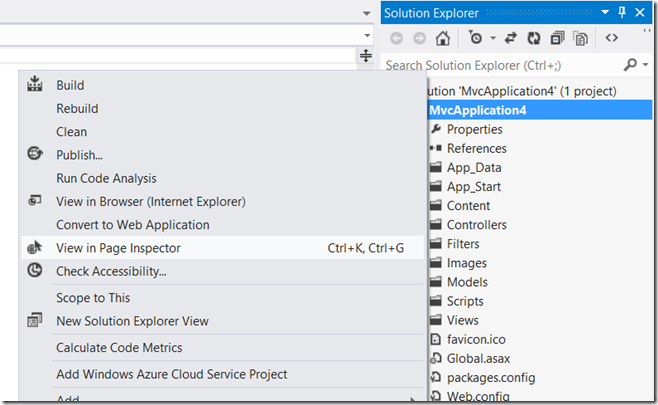
Instead of hitting F5 I selected “View in Page Inspector” from the Solution context menu:
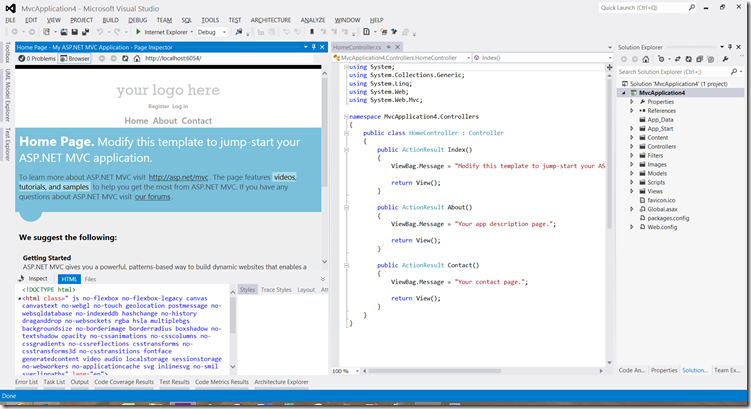
This then starts to load up the application within the Page Inspector windows inside Visual Studio. At a simple level this provides the equivalent of “F12” functionality within IE – you can view and browse the DOM:
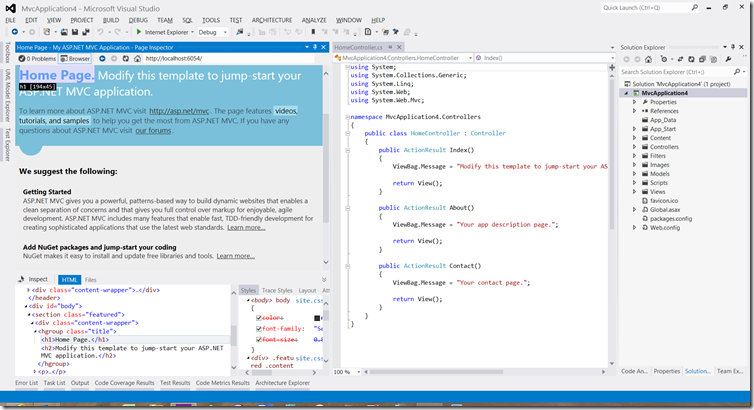
As you select elements in the DOM, the UI elements are highlighted in the integrated browser:
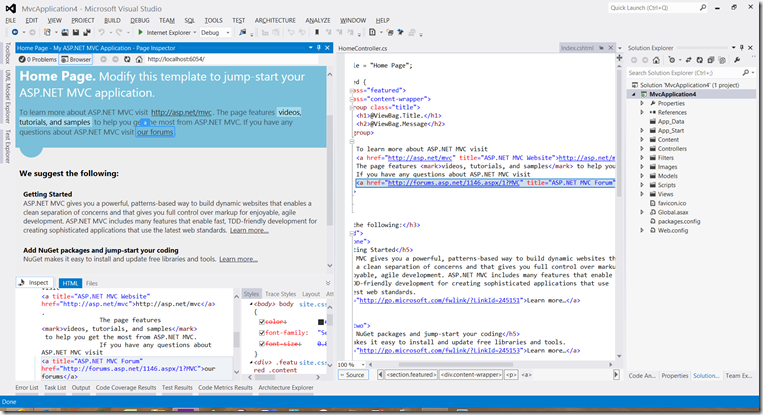
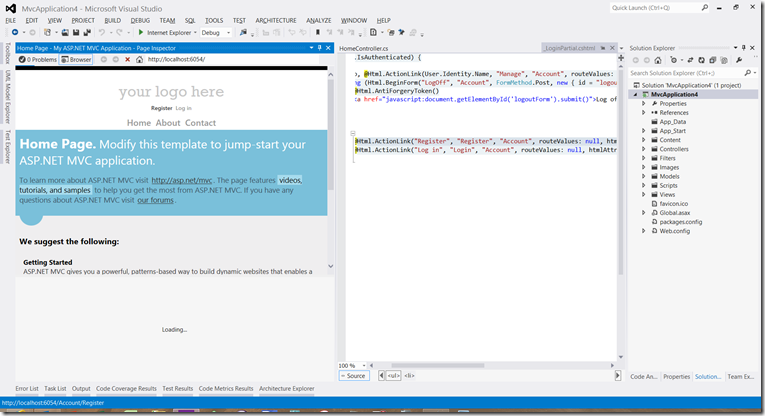
Click “Inspect” in the Page Inspector and now the source code that produces the relevant part of the UI and DOM is opened in the Preview Tab in the edit. In this case I’ve inspected the link at the top of the page that says “our forum”, and the file that’s opened is index.cshtml, with the relevant line highlighted:
The Page Inspector allows you to interact with the application so here I select “Register”:
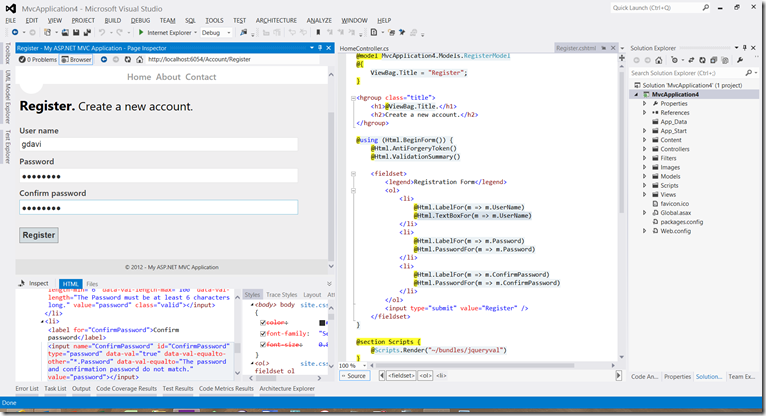
Complete the registration form, noting that I can see the values I enter in the DOM, and see the source code for that form:
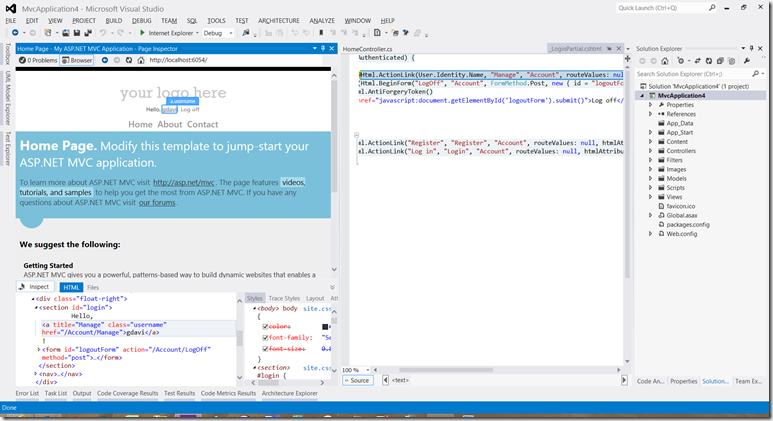
Having selected OK, I inspect my user id (gdavi) in the “Hello, gdavi” at the top of the page. This allows me to see the relevant file(_loginPartial.cshtml) and lines of code.
There’s a lot more to the Page Inspector, such as editing the DOM elements and CSS and seeing the results, but I hope this whets your appetite. A video probably helps to visualise this more so I’d recommend watching this 16 min Page Inspector video on Channel 9.
Cheers,
Giles
