Visualize the health of your builds – latest sneak preview of the Team Project Health extension
Visual cues are essential to monitor our CI/CD pipelines, detect potential issues, and react before the users are affected. Whether you have a few or hundreds of builds, visualizing their health is important to avoid surprises and deliver continuous value. The Team Project Health extension, created by Wouter de Kort, Jakob Ehn, Utkarsh Shigihalli, and Ed Elliott, enables you to visualise the health of your builds on your dashboards.
Building on the early sneak preview in February, here are two of the key updates contained in the v1.1.13 preview S114 release:
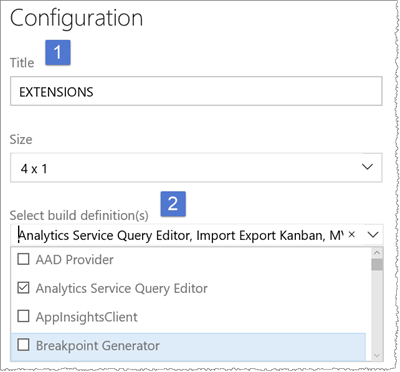
[1] - Support for configuring the name of build OVERVIEW widget
You can add multiple overview widgets to your dashboard and assign a descriptive (for you) name to each widget.
 [1] Configure name, [2] Select builds
[2] - Support for selecting builds to be included in build OVERVIEW
By default, the overview widget continues to present an aggregated status for all the builds.
You can select which builds to include in the aggregated status.
What’s next?
This is still an early preview to share the concept and to get your feedback. Future previews will include the same widgets to visualise your releases.
What else would add value for your DevOps dashboards?
Feedback
We need your feedback! Here are some ways to connect with us:
- Add a review on the marketplace
- Add a comment below

