
Public Preview: New Widgets for Visual Studio Team Services
(Updated May 10, 2017)
We’re now taking our three new widgets into a full public preview. No need to email us for access… just head over to the marketplace to install the new Analytics extension.
Today we’re releasing a private preview of three new dashboard widgets for Visual Studio Team Services (VSTS). The term “Private Preview” simply means we’re not quite ready to turn these new widgets on for all customers; instead, we are selectively on-boarding accounts. The new widgets are built on top of our new Analytics Service (AX) and designed to provide additional insight beyond what’s currently available in VSTS. We’re planning to accept up to 200 accounts into the private preview.
If you’re interested in having these widgets turned on for your account, please email us at vstsaxfeedback@microsoft.com. Include your full name, and the URL of your account.
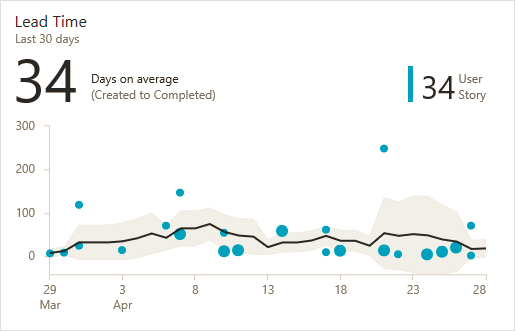
Lead Time
Lead time is defined as the time between work item creation, and work item completion. Lead Time helps you understand how long it takes for work requested by a customer to be delivered. In addition, you can identify and investigate outliers, as well as see trends. Reducing your lead time leads to quicker innovations and happier customers.
- On average, how long does a customer request take to be fulfilled?
- Did this feature take longer than usual to complete?
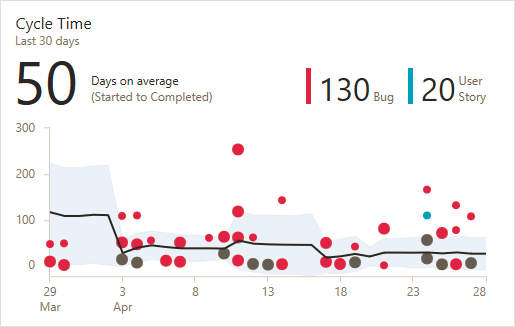
Cycle Time
Cycle time is defined as the time a work item spends in development before it is closed. Cycle time helps you analyze the time it takes to deliver work from your backlog. A lower cycle time is typically indicative of a healthier team process.
- On average, how long does it take my team to build a feature or fix a bug?
- Are bugs costing my team a lot of development time?
Cumulative Flow Diagram (CFD)
The CFD widget is a configurable chart that shows the count of work items (over time) for each column of a Kanban board. This allows you to see patterns in your team’s development cycle over time.
- Is there a bottleneck in my process?
- Am I consistently delivering value to my users?

What’s Next?
Beyond these widgets, we have a lot more planned. The immediate next step will be to deliver additional widgets include:
- Velocity – Track the progress of your team’s work across iterations.
- Burndown – Burndown all types of work across a configurable date range.
- Burnup – Burnup all types of work across a configurable date range.
- Trend/Glide – Track the trend of work over time.
If you have ideas for additional widgets you’d like to see us prioritize, don’t hesitate to shoot us an email at vstsaxfeedback@microsoft.com, or head over to UserVoice to add your support for an idea someone has already suggested.
Thanks. Aaron Bjork
 Light
Light Dark
Dark
0 comments