
Cloud-load testing service is hyper-scale ready: lessons from generating 1M concurrent user load
Every now and then we hear of a business-critical app failing during major promotional or seasonal events such as holiday sales. More often than not it turns out that the app is not ready for the massive demand created on such occasions – causing the servers to fail and resulting in dissatisfied customers and lost opportunity. To ensure that your app doesn’t make the headlines for the wrong reasons, we recommend that you use the cloud-load testing (CLT) service to validate that your app can handle massive spikes. 🙂
It also means that the tool or service that you use for load testing be able to generate the load at the scale you need. Here in the cloud-based load testing world, we recently did some infrastructure changes and are happy to announce that the CLT service is hyper-scale ready! As part of the validation of our readiness, we successfully ran tests to generate concurrent user load of as many as 1 million (1M) users. Note the concurrent part – this means that all 1 million users were active at the same time! Woohoo! Our tests covered both the cases – automatically provisioned agents as well as ‘bring your own subscription‘ scenario using Azure IaaS VMs. This means that you can run hyper-scale tests regardless of whether you choose the auto-provisioned agents or want to bring your own machines.
The infra changes we did have brought in additional benefits. Two of them are worth calling out here:
- You can now pack upto ~2.5x more virtual users per agent core than earlier. Our earlier guidance when using declarative webtests was that between 250-1000 virtual users could be generated from an agent core. That number is now 600-2500.
- Overall resource acquisition time has reduced by more than 50%. This means that load tests now spend much lesser time getting the agents ready and will start faster. If for some large runs you saw a wait time of 15 minutes earlier, that would come down to 7 minutes now. Of course, resource retention feature continues to be available to help you reduce that wait time further, if you want to run load tests in a test->fix->test loop in a short period of time.
The rest of this blog post covers some of the questions that come up when running massive load tests. We will also look at the test settings that impact how load is generated, so you can tweak them appropriately to generate the desired load.
First, here’s a screenshot of one of the tests we ran:
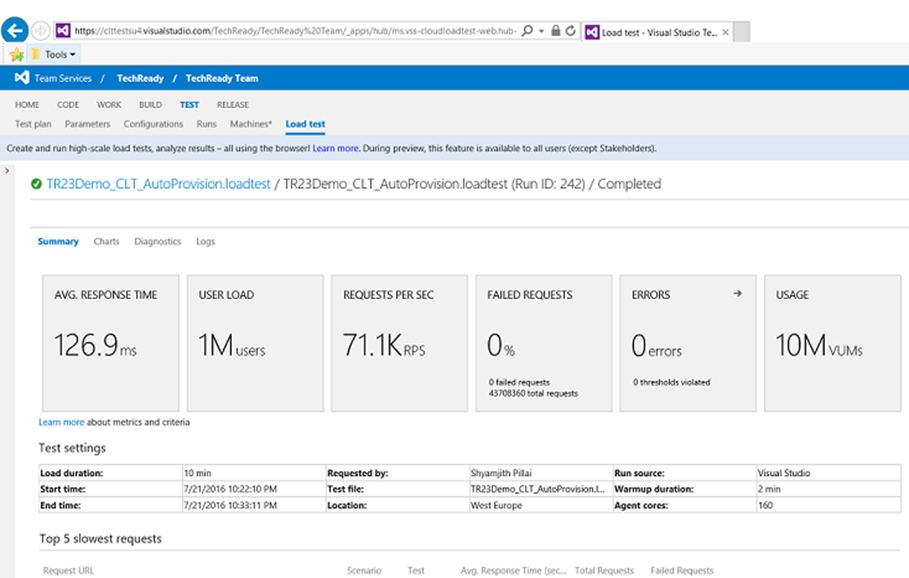
Did you see that – while simulating 1M concurrent users, 43.7M total requests were generated at a massive 71.1K RPS, with 0 failures ! Ain’t that cool? Let us now look at the details.
App Setup: Since our intent was to validate that 1M concurrent users could be generated, we wanted the app to be one that would scale easily. This was so that we could focus on the core validation and on fixing any issues we may find in the service and not have to worry about how to get the app to scale. We used a simple ASP.NET Web API comments app and deployed it to a set of Azure IaaS VMs behind a load balancer. As we ran the tests with increasing loads, whenever we found the app had reached it’s limits, we added some more VM instances to beef it up. To get the app to serve 1M concurrent users worth of load, we used 12 instances of Standard_D4_V2 VMs in Azure.
Test: Using Visual Studio, we created a webtest that made requests to the homepage. The load test was set to use the constant load pattern, simulating a million concurrent users at once. In real life, usually the load ramps up over a period of time. But since we wanted to validate that our agents could simulate even an extreme condition with ease, we decided to go with the massive constant load. If you are interested in looking at the tests, they can be found on github, here.
One of the most frequently asked questions is “how many virtual users can be generated by a single agent and how many agents are needed for my load test?”. Like most interesting questions, the answer to this one too is ‘it depends’. Since each app is different, the corresponding test that simulates the user scenario is different too. Your test could be a declarative webtest or you could be writing code in a unit test or a coded webtest to most accurately mimic the scenario you are looking to validate. Tests can even use custom plugins. As test runs, resources such as CPU, memory, disk, etc. are consumed on the load generating agent. Performance counters for these resources on the test agents are collected during a load test and can help you determine whether more vusers can be packed on the agent. The recommendation is to start with a small load to figure out the agent capacity for your particular test before doing a massive load test run.
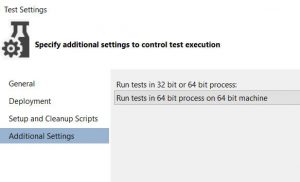
As you try to pack more users on a single agent, you may run into out of memory exceptions. It is recommended that you run in 64 bit mode so that a large addressable memory is available for the tests when running. You can do so using the testsettings.
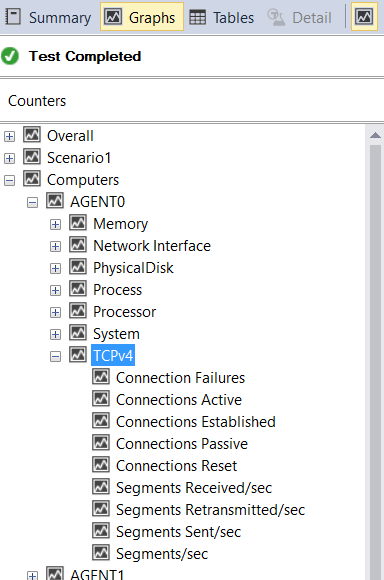
The above screenshot shows various performance counters that can be collected on the agents. These are useful to determine the agent capacity for your test, based on the various resources your test consumes. Apart from the usual metrics such as CPU, memory, etc., we also collect data for the TCPv4 counter category. This one is interesting to look at when you run hyper-scale tests. When a load test runs and makes requests to the app, sockets are used for the connections. If requests fail with SocketExceptions, you want an easy way to determine whether the connection failed because the app couldn’t handle the load and closed the connection or whether the agent is reaching it’s socket capacity. Every agent machine can make upto 64K connections.
You may now be wondering as to what are the factors that impact how many connections are made for a virtual user and if are there any settings that you can tweak to get the most out of a load agent. The answer lies in the “webtest connection model” setting. This setting controls how connections are used when a load test containing a webtest runs.
The Connection Per User model closely simulates the behavior of a user who is using a browser. The first connection is established when the first request in the Web performance test is issued. Additional connections may be used when a page contains dependent requests. These requests are issued in parallel by using additional connections. Up to 6 concurrent connections may be used to closely simulate browser behavior. A drawback to generating load using this model is that number of connections held open on the agent will be high (upto 6 times the user load) and thus limit the user load that can be generated. Additional memory (associated with the connection) is also consumed and extra processing time is required to close and reopen the connections as web tests complete and new web tests are started. For high user loads, we recommend that you use the “Connection Pool” model.
The Connection Pool model conserves the resources on the load test agent by sharing connections to the Web server among multiple virtual users. If the user load is larger than the connection pool size, the Web performance tests that are run by different virtual users will share a connection. This could mean that one webtest might have to wait before it issues a request when another webtest is using the connection. The average time that a Web performance test waits before it submits a request is tracked by the load test performance counter Average Connection Wait Time. This number should be less than the average response time for a page. If it is not, the connection pool size is probably too small and will likely limit the throughput of your page. An appropriate connection pool size can be determined using this formula:
Connection Pool Size = 64,000 / (Max Parallel Connections { = 6 if there are dependent requests in your test}*Number of Server URI Host
If requests are served through CDN, you will need to adjust the number of server URI host accordingly.
To determine the pool size, run the webtest you want to run in your loadtest locally and use the result to determine whether you have dependent requests and the # of Server URI Host. This is because most dependent requests such as javascript, css, images, etc. are not recorded when the test is authored. Instead, the content of the response is parsed and the additional requests for this content is made during execution. So, even if dependent requests don’t show on the authored test, they may be present and that can be determined by looking at the result of the execution. Let’s take some examples.

This screenshot shows the result of a webtest that makes a request to bing.com. As you can see in the results, there are no additional requests getting generated (the second request to bing.com is the result of a 302 redirect and not a dependent request). Also, the only server URI being reached is bing.com. Since I don’t have any other requests in the test that could have dependent requests that need examining, I arrive at Max Parallel connections = 1 (no dependent requests) and Number of Server URI host = 1 (bing.com). This gives me a pool size with the entire range of 64K.

In this second example, again I have a single top level request to my Azure website. The results show that there are several dependent requests (images, css, etc.), but all content is being served by a single server host. This means my Max Parallel Connections = 6 and Server URI Host =1, which gives me a pool size of 10667.
Similarly, if I had some dependent requests that got served via a CDN, my server URI Host # would increase and my pool size will need to be adjusted accordingly.
What does all this translate to when running load tests? When running large tests, if the pool size calculation is smaller, you will likely need more # of agents to generate a higher load. In the above test, we reached the desired load with just 20 agents of 8 cores each, that is a total of 160 cores. Every VSTS account by default can run tests with as many as 200 cores – for the most part, we have found that this meets the needs of our customers. Every once in a while though, if you are running a massive load test and you need more agent cores for your tests, you can reach out to us at vsoloadtest@microsoft.com
And last, but not the least, monitoring the app when the load test runs is also important and helps with troubleshooting when any issues occur. Use app monitoring tools such as Application Insights.
Hope you enjoyed this post – we look forward to hearing about your app’s success with CLT. The effort to validate the hyper-scale readiness of the CLT service was a joint effort between the Visual Studio load test product team and the Microsoft Testing Services team (Dindo Sabale, Shyamjith Pillai and Dennis Bass – thank you for the great run on this one!). If you need consulting services for testing your applications, you can reach them at srginfo@microsoft.com. The Testing Services practice is part of Microsoft Enterprise Services and focuses on assisting customers with all of their testing needs including functional, performance, test strategy, knowledge transfer, and general consulting on all aspects of testing.
As always, for any feedback or queries related to load testing, reach us at vsoloadtest@microsoft.com
 Light
Light Dark
Dark
0 comments