
Searching and filtering the Events tab of the Diagnostic Tools window
With Visual Studio 2015 RTM we shipped the first version of the Diagnostic Tools window. In Visual Studio 2015 Update 1 we’ve made the following improvements to the Events tab of the Diagnostic Tools window to help you read through and understand the list of events even faster and more efficiently than before:
- Improved the filtering menu
- Added the ability to search
- Added category prefixes to all events
**Note: ****These improvements are available in all editions of Visual Studio. However, the screenshots used in this blog post come from Visual Studio Enterprise, which has IntelliTrace, giving you access to more event categories than other editions.
Let’s take a closer look at each of these improvements.
Category prefixes
We added category prefixes to all events in the list to improve readability:
Search
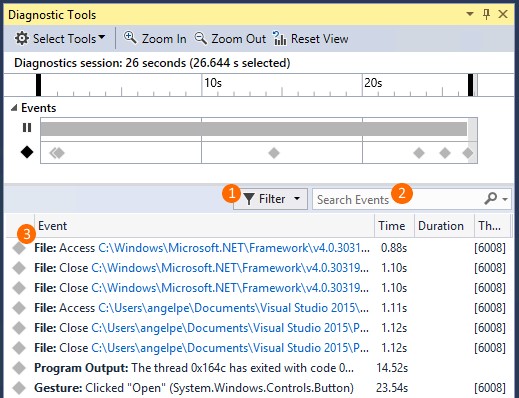
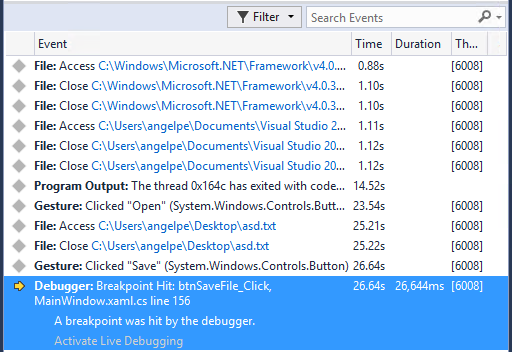
Next to the filtering control you will find a new search box. The behavior of this search box is identical to the one you have been using in the Visual Studio Error List window. You can search on any visible column in the Events tab, both while the application is running and while it is stopped under the debugger:
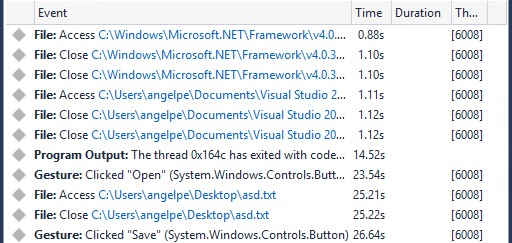
**Event list before searching
 **
**
**Event list after searching for “close”
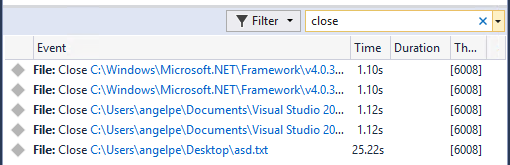
**
If you choose the Esc key, you can clear the search term and filtered search results. You can also click the X on the right side of the text box to clear it.
Improved filtering menu
The new filtering menu allows you to customize which events show up in the list in 3 different ways:
- based on their category, e.g. I only want to see ASP.NET related events
- based on their thread, e.g. I only want to see events created by Main Thread
- based on Just My Code, e.g. I only want to see events created by my code
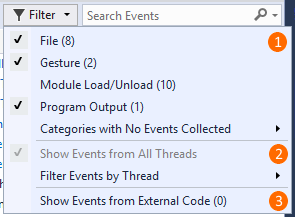
The filtering menu helps you manage the long list of categories by only showing categories that have events. Whether a category is checked or unchecked determines if it will be filtered in or out of view respectively (all categories are checked by default, except for Module Load/Unload).
To help you even further, the filtering control shows you the number of events collected for each category next to the category name. This number is not affected by time selection, Just My Code or thread selection. It is guaranteed to always be the total number of events collected for the category in the entire debug session.

Categories for which no events have been collected or for which collection has been turned off can still be found under a sub-menu. This sub-menu gives you access to more categories and allows you to quickly change which events are collected by default when you debug:

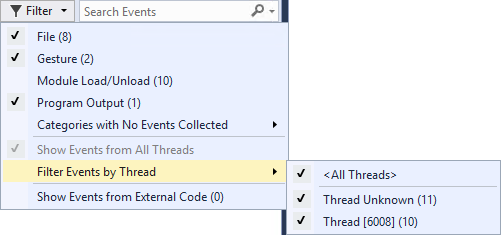
The Events tab shows events from all threads by default, but the filtering control gives you the ability to filter based on the creating thread. You can quickly get back and see events from all threads by clicking on “Show Events from All Threads”:
If you have the Just My Code feature enabled, by default the list will not include events not originating from your code, but selecting “Show Events from External Code” will allow you to filter into view the events that originate outside of your code (e.g. framework code, 3rd party library, etc.):
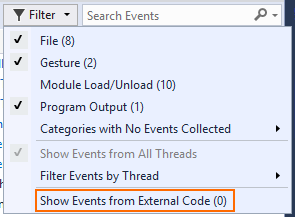
In the example above events from external code are filtered out of view, but even if they were filtered into view their count is 0.
Wrap up
Install Visual Studio 2015 Update 1 RC today and try out these improvements. As always, we welcome feedback so please let me know what you think in the comments section below, through Visual Studio’s Send a Smile tool or through UserVoice.
 Light
Light Dark
Dark
0 comments