
Modern Apps & Agile Analytics
Introduction
Agile software development came out of a number of experimental approaches taken in the late 1990s to change the way software was planned, developed and delivered. One of the essential components common to all agile methods is the concept of incremental delivery. When an engineering team adopts an incremental delivery paradigm, they stop trying to “design it all exactly right” and instead strive for constant learning, from the customer and from the code, and then apply that learning into future increments (also called iterations).
Today we typically see developers creating apps in a “cloud-first” or “mobile-first” approach (or more likely, a combination of both). In this world delivering apps to customers can be streamlined such that engineering teams can ship new capabilities and features to their customers very frequently, often many times per day.
This continuous delivery model has some interesting but subtle effects on how we engage with customers and make decisions about where to make investments. The key to effective decision making in this world can be summed up in a single word: Data.
The Product Owner
 In a typical agile process, there is someone the team engages with who represents the customer. In Scrum this person is the Product Owner (PO). As the voice of the customer, the Product Owner is the ultimate decision maker over what features will be developed, and what the relative priorities are. But how do they make those determinations? Trying to be a subject-matter expert, and then “go with your gut” is certainly an approach many product owners take, but is it the best?
One tool most product owners depend on is direct communication with customers and stakeholders. When a customer tells the Product Owner “this doesn’t work right”, or “I need that capability”, that’s direct, tangible feedback into the prioritization process. But when your product ships every day or every week, this form of data collection may be too slow.
Even worse, depending entirely on first-hand accounts can lead to bias. It can be very difficult to determine if a particular customer ask is something that all of your customers are experiencing or whether it is a one-off caused by something idiosyncratic to that customer. The Product Owner needs a way to test that feedback and evaluate it against their entire customer base. And they need to be able to do it quickly without waiting for things like focus groups or other slow-to-gather information sources.
Use Data to Prioritize your Backlog
What if you could collect data from your customers, without any additional cost to them, and then use that data to test and evaluate hypotheses? Today’s application analytics platforms, like Application Insights, enable exactly that. By collecting real usage data from thousands or millions of users, you can quickly ask questions about how they are engaging with your software. Then, you can formulate hypotheses about how potential changes will affect them, and after delivering the changes, you can test to see if your hypothesis was correct or not.
 Let’s imagine a team that is developing a mobile game. Like many mobile games, this one uses micro-payments to earn revenue. As the game progresses, the players buy special capabilities to help them overcome the challenges they’re presented with.
As the Product Owner, you notice that you’re not selling as many Super-Duper Rayguns as you had hoped. You expected that upon encountering the Orange Space Goblin Boss, players would buy the gun to get past her.
What you need is data. There are a number of questions you might have, all of which you could answer with the right telemetry. For example:
- When people get to the Orange Space Goblin level, did they buy any upgrade to get through it? (Level difficulty)
- If they look at the raygun, and choose not to buy it, do they buy something else? What do they buy instead? (Item attractiveness)
- Do they come back and look at the raygun over and over, but still choose not to buy it? What do they look at before buying? Do they even look at the raygun? (Item pricing)
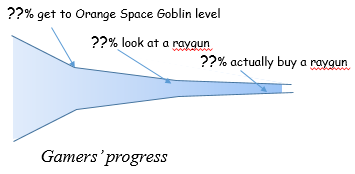 This is really no different from a classic purchasing funnel. Customers go from awareness through interest to desire and, hopefully, action. If you only know that you aren’t selling as many rayguns as you wanted, you don’t know which stage you’re losing them. Before you can effectively make a change in the product, you need to identify the actual problem with cold, hard data.
When you are a Product Owner, having the answers to questions like these gives you concrete data you can use to make an informed decision. It helps eliminate emotional or “gut feel” decision making about what, if anything, you should change. Perhaps the level needs to be made easier. Or harder. Or maybe the raygun needs to be cheaper.
But sales funnels aren’t the only way you can use analytics.
Run an experiment
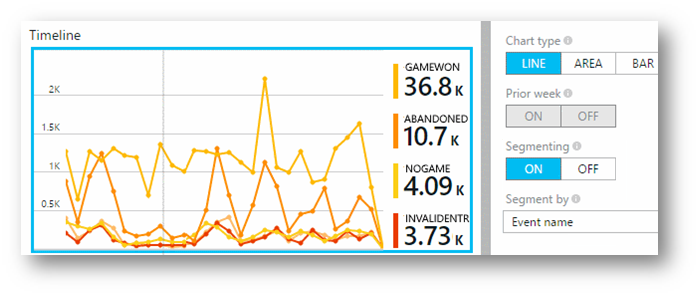
 Experiments give the best answers to some questions. Imagine you suspect the price is too high for the raygun, so people are trying other things or simply giving up. So for one week, when people reach the space goblin level, you offer them the raygun at 50% off. At the end of the week, you compare the numbers with those from previous weeks and make a more informed decision about making a change.
Or even more interestingly, you offer the cheaper price to a randomly-selected half of your users and compare the behavior of the two halves (and hope they don’t talk much to each other).
How bad is this bug?
Let’s say you’ve received a bug report that your web app is crashing when the user tries to do a certain action in Feature X. But you only heard it from one or two customers, and not from the hundreds of other customers who are regularly using the app. Before we decide whether to do an in-depth investigation and change the code, we can once again use data to make an educated triage decision. For example:
- How many people are using Feature X? Of those, how many are trying to do the action reported as broken?
- Of those, can we correlate them to crashes in the app, or exceptions created in the code?
- Are there correlations between those crashes or exceptions and service dependencies, load spikes, or other environmental concerns (e.g. memory, disk space, etc.)?
- Is there a correlation to a certain time of day or day of the week?
- Does the error only occur for certain accounts? Or certain geographies? Or languages?
Answers to questions like these enable you to make informed decisions about prioritization. Not all bugs needs to be fixed immediately, and not all reported issues are even bugs. Knowing how many customers are affected, how they are affected and what causes them to be affected are key to making a decision about an issue. Correlating it back to other data you’ve collected adds even more information, letting you make the right decision at the right time.
Application Insights
Visual Studio Application Insights is the perfect tool to help you answer the kinds of questions discussed here.
Application Insights gives you visibility not just into the usage but also the availability and performance of your application. After getting started with just a few clicks, you get an immediate 360-degree view of your application and can quickly investigate and explore deeper into the telemetry you’ve collected.
To learn more about Application Insights and how you can use it to make better apps, faster, read Get Started with Application Insights.
Conclusion
Software projects are moving at a pace faster than we’ve ever seen before. The iterative and incremental nature of agile development aligns very well with this sea change, but puts the Product Owner in the challenging position of making decisions very quickly.
Data is the Product Owner’s tool to avoid seat-of-the-pants or emotionally charged prioritization. Think about the key questions that should guide your product’s development; collect the data you need to answer them; and extract the answers using a strong analytics platform like Application Insights. That way, you can make the right decisions quickly.
 Light
Light Dark
Dark
0 comments