
New Breakpoint Configuration Experience in Visual Studio 2015
If you use Visual Studio to develop code, the chances are good that you set breakpoints on a regular basis as part of debugging. You may however not be aware that breakpoints can be configured with conditions and actions to improve your debugging productivity. In Visual Studio 2015 we’re pleased to introduce an improved experience that makes configuring breakpoints significantly easier to find and use for breakpoints associated with a specific line of source code:
- Conditional statements break only when conditions you specify are met. Think of this as adding an “if” statement to your code and placing the breakpoint inside the “if” statement so it is only hit when the conditions you entered are true.
- Hit counts break only after the breakpoint has been hit a certain number of times. These are useful in situations where code is called multiple times, and you either know the exactly when it is failing, or have a general idea that “it fails after at least” a certain number of times.
- Filters break when the breakpoint is hit on a specific thread, process, or machine and are useful for debugging code running in parallel.
- Tracepoints print a message to the output window and are capable of automatically resuming execution. These are useful for doing temporary logging when you need to trace something and don’t want to have to break and manually track values.
In this post I’ll show you how to create and configure breakpoints with the new experience. Then we’ll walk through debugging several problems using each type of configured breakpoint along the way.
Updated Experience
The first thing you will notice when you set a breakpoint is a small toolbar appears next to the breakpoint glyph (the red circle in the left margin) that has two options, settings, and an enable/disable breakpoint toggle.

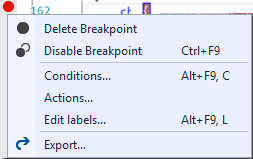
If you prefer to access the settings from the context menu, we have consolidated the options for accessing the various settings to simply have “Condtions…” and “Actions…” for entry from the glyph itself and to have “Settings…” from the Breakpoints window (if you’ve used these in previous releases of Visual Studio you will remember there was a separate menu option for each type of breakpoint).
When you select “Settings…” for the breakpoint a non-modal Peek window appears in the editor where you can configure all possible settings for the breakpoint. You should think about the possible settings for a breakpoint as falling into two categories:
- Conditions: control when the breakpoint is hit, by default a source breakpoint implicitly has the condition of “when execution reaches this location”
- Actions: control what happens when all of the breakpoints conditions are satisfied. The default implicit action is “break”
You can see below that the updated UI reflects this way of thinking about breakpoints.
![]()
Since this is a Peek window, it is non-modal and inserted between the lines of code (it is between line 87 and line 88 above, it does not cover any source). This means that I can continue typing, copy and paste from the editor into the dialog, etc. To dismiss it click on the “Close” button. Note that all changes are saved automatically, there is no cancel button.
Tip: You can use the context menu options of “Conditions…” and “Actions…” as a shortcut to open the peek window with the respective checkbox already checked so focus is in the edit box ready for input.
To see configuring conditions and actions, continue reading…
Walkthrough
The example app we are going to use has Web API services that are consumed by rich client applications. I’ve been asked to create an encoding library so communication between the two is no longer passed in plain text. You can follow along with the post by downloading the attached sample that uses a shift cipher. Note: For the purposes of keeping the sample as simple as possible I’ve placed all the logic into a console application, normally I would place the tests in a separate unit test project.
I’ve written the basic logic, and validated that encoding and decoding “Hello World” works as expected. Unfortunately, my next test that checks every ASCII character is failing on character 75.

Hit counts
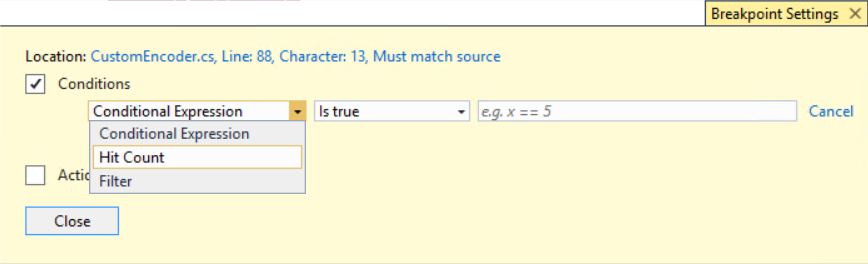
To debug this I set a breakpoint in the applyByteShift function (in CustomEncoder.cs, line 84) where I’m doing the byte shift during encoding. Since I know it’s failing on the 75th character I want the debugger to break only when applyByteShift is called by that iteration of the test loop testing. I could use a conditional statement when the byte passed in is 75, but I can’t be sure that isn’t part of the problem. Instead, I will set a hit count breakpoint to break the 76th time this function is called (it’s a 0 based loop, so character 75 is passed from the 75 + 1 iteration of the loop) since that will guarantee I break in the failing code path. I open the settings window for the breakpoint, and check the “Conditions” checkbox. I see a grid that is waiting for me to enter a conditional expression.
![]()
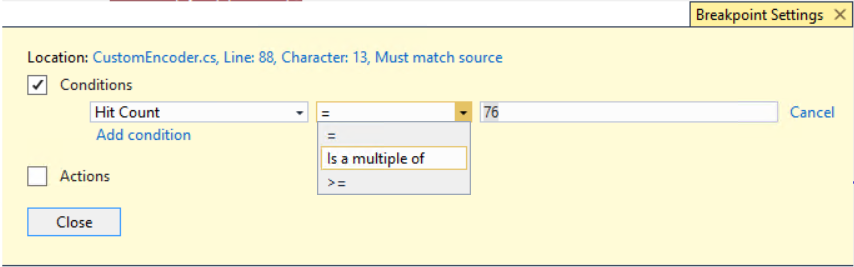
Since I’m going to use a hit count instead, I click the dropdown and choose “Hit Count”
I enter ‘76’ and press Enter. Note, once I’ve specified a valid value, the change will be automatically committed as soon as focus leaves the control whether I press Enter, click outside it, start debugging, or close it.
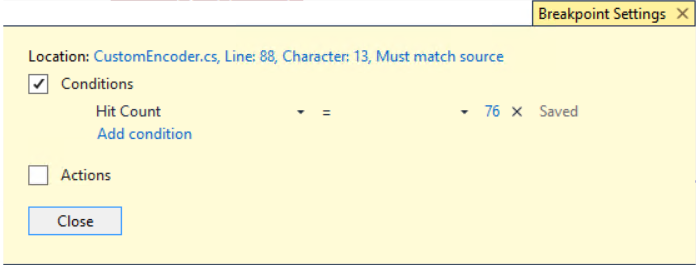
I can also change the comparison operator on the Hit Count to choose between equals, is a multiple of, and greater than or equal to.
To edit the value again, I just need to select the specified value (e.g. by clicking on it) and it will return to an editable state.
At this point I could choose to add another condition if, for example, I wanted to use hit count in combination with a conditional expression or filter. I don’t need that at the moment however so I’ll start debugging and because the Peek window is non-modal I don’t even have to close it! Reminder: changes are automatically saved, there is no cancel after you make an edit.
When the breakpoint is hit, notice that I can see the current hit count in the Peek window, and have the option to reset it.
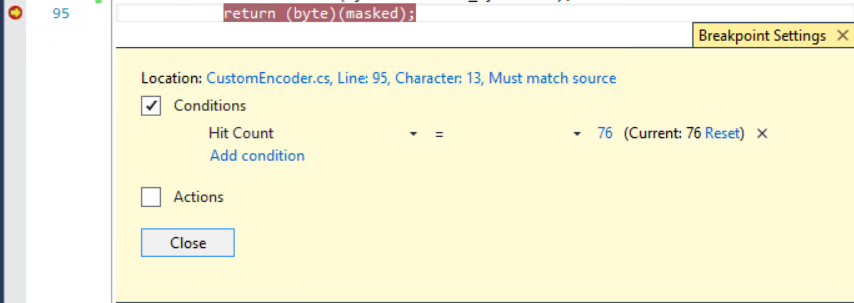
Note: you can see the current hit count for a hit count breakpoint the breakpoint’s tooltip

…and the hit count for any breakpoint (regardless of whether it has a hit count condition specified) is shown in the breakpoints window while in debug mode.

Once my breakpoint is hit, looking at the data values I can see the bug is that after the byte shift, character 75 becomes 128 which is not a valid ASCII character.

TIP: *You can pin a DataTip to the editor as shown in the screenshot above*
To fix this issue, I will use modular arithmetic in both applying and removing the byte shift (so 128 will become 1 which is valid).

Running it again the test for every character now passes

It’s time to move on to testing this when calling my Web API methods.
Conditional statements
The application I’m testing against keeps track of the projects my team has created or collected over the years. I’m going to start by retrieving applications from an API that accepts the desired application type (e.g. Mobile, Desktop, or Web). The goal is to encode the parameter before it is passed, and then decode it on the service side returning matching applications. Running my tests shows that it succeeds for two out of the three types I’m attempting to retrieve.

I suspect that it isn’t being decoded correctly on the remote side so I want to debug through that code path, but only for the failing case. Meaning I want the debugger to stop when the parameter passed is “Desktop” but not when it’s “Mobile” or “Web”, which is the job of a conditional breakpoint. However, since I suspect the problem is that “Desktop” isn’t being decoded correctly I can’t use that as my condition, instead I will set my conditional statement to break whenever the decoded value is not “Mobile” or “Web”.
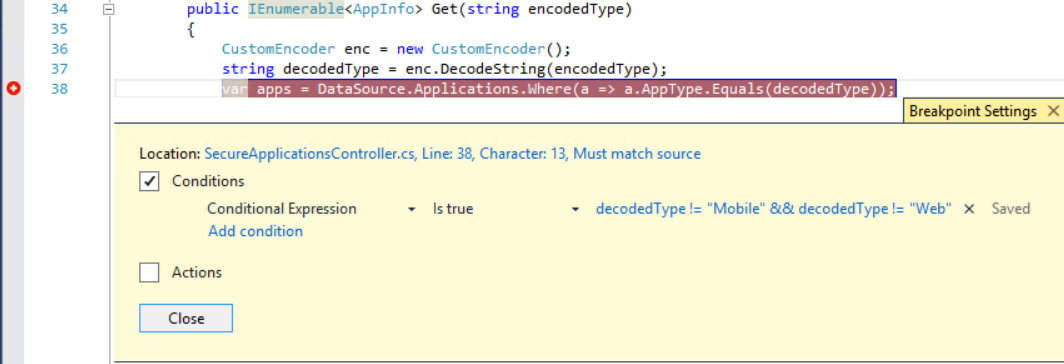
It is worth noting that conditional expressions can be as complex or as simple as you need. Any expression that evaluates to a Boolean value in the language your application is written in is valid input.
Now that my breakpoint is set, I configure my solution to start both the web project and console application, and start debugging. The debugger breaks and I can see that for some reason the word “Desktop” is decoded to “Deskto”

Actions
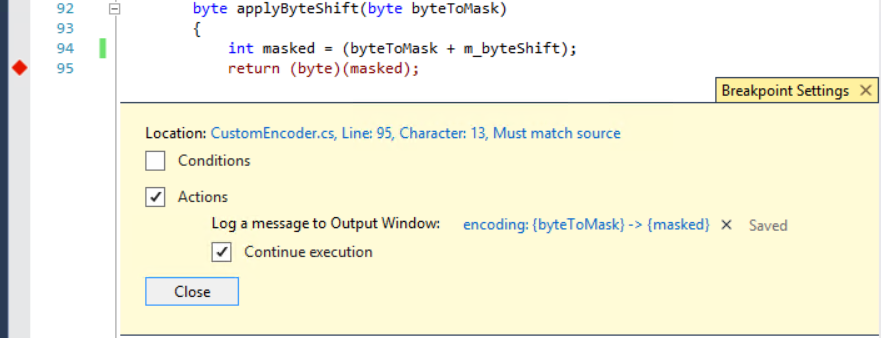
In order to figure out why the word “Desktop” isn’t being coded correctly, I want to record exactly what each character is encoded to on the client side, and then see the corresponding decoding for the same characters on the server side. I don’t want to have to break for each character and manually record it somewhere, so I’m going to add an action for the debugger to log the characters to the Output window as they are encoded and decoded.
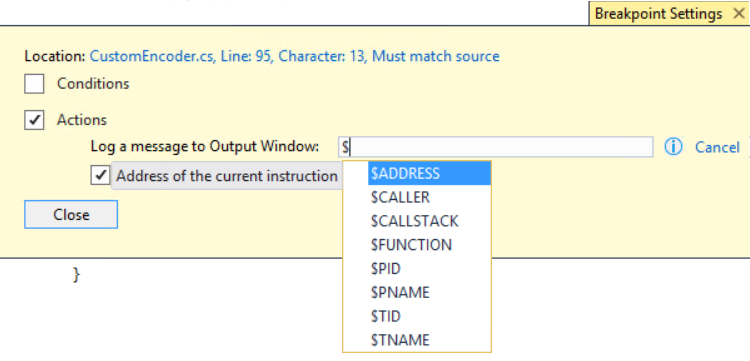
To do this, I set a breakpoint on the function that applies the byte shift, and click the “Actions” checkbox to add an action to Log a message (called a tracepoint). Also, a second checkbox “Continue execution” appears and is checked by default. When checked, the breakpoint will automatically resume execution of your program after printing the message. If you want the breakpoint to print a message and also stop until you manually resume execution, uncheck this box.

Additionally, note that the debugger offers information that can be printed by referencing pseudo-variables denoted by a $. In Visual Studio 2015, we’ve added IntelliSense for the available pseudo-variables.
To debug my current problem I don’t need any of the pseudo-variables, so I’ll change the message to show what the original byte code is, and what it is changed to. Note, that to print values from variables in the application, the variable name needs to be placed inside curly braces (expressions are subject to the same limitations as the watch window, if it cannot be evaluated in the Watch window it cannot be evaluated in a tracepoint). Anything that is not inside of curly braces will be printed as typed. For example “Hello world” will appear as “Hello world” in the output window, where “Hello {world}” will appear as “Hello
Combining Conditions and Actions
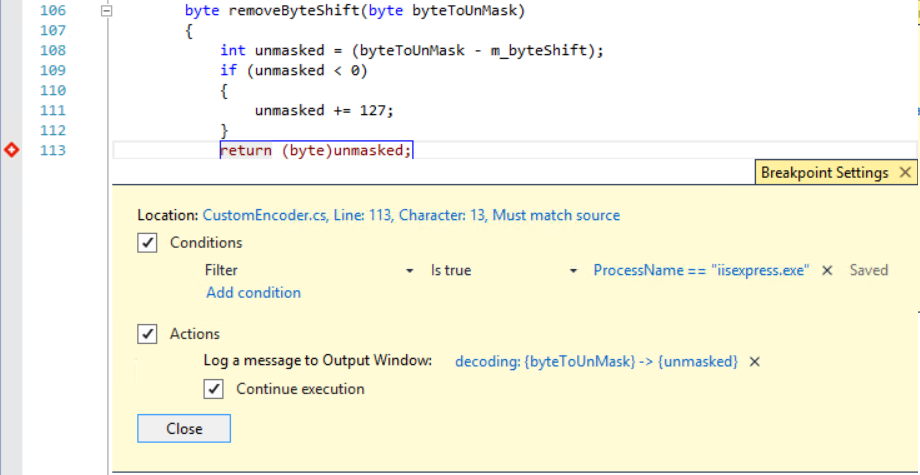
Next, I’ll move to the function where the byte shift is removed, and add a tracepoint to capture what is happening when the byte shift is removed. However, since I have other tests running that are decoding strings there is the potential for a lot of extra noise in the Output window. To reduce this noise I am going to set this tracepoint to only print when it is hit in the server process, meaning it won’t print anything when this code path is executed in the console application running the tests. A breakpoint conditioned on the process, thread or machine is called a filter breakpoint.

Since I’m running the server code in iisexpress, am going to add a Filter condition of ‘ProcessName == “iisexpress.exe”. Notice that IntelliSense is now available for the filter properties in Visual Studio 2015.
When I run this, I see that the last character is being dropped from the string (char 38 is never decoded).

A look at ASCII character 38 show it is an ‘&’ which is a special character when used in URLs. So it is being dropped from the string passed via the URL. To fix this and any other potential problems with special characters, I tweak the code to convert the encoded bytes to a base 64 string instead of ASCII.

After this change all of my tests are now passing.

Changing settings from the Breakpoints window
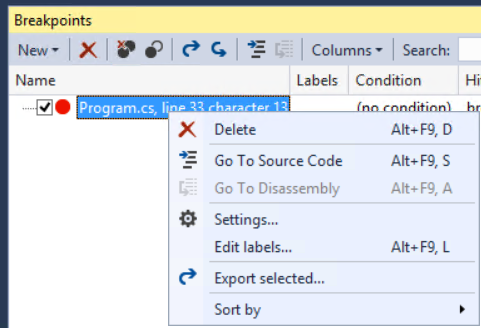
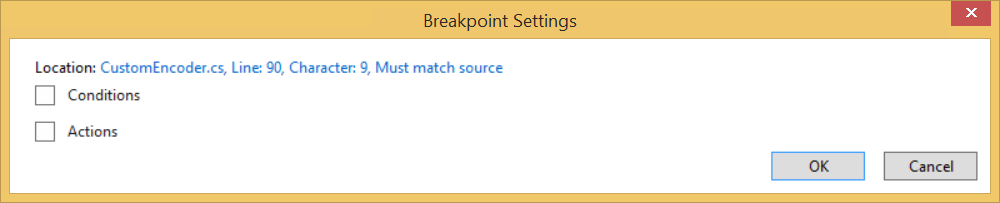
Breakpoint settings can also be accessed by right-clicking a breakpoint in the Breakpoints window (accessed from the menu by Debug -> Windows -> Breakpoints) and choosing “Settings…”.

When the settings are opened from the Breakpoints window, the settings UI will be the same that was seen in the Peek window, but it will appear in a dialog box, rather than changing the editor to that source location and opening a Peek window (if instead you wanted to navigate to source for that breakpoint just double click on the breakpoint).
In Conclusion
In this post we walked through an example of configuring each possible setting for a breakpoint in the new breakpoints experience. While we didn’t combine the options in all possible ways, hopefully you can see how you can configure breakpoints to debug issues more efficiently. Feel free to download the attached sample and try it yourself, and read our previous posts covering each breakpoint type in more detail.
If you have any questions or feedback on our new experience or breakpoints in general I’d love to hear them below, through the Send a Smile feature in Visual Studio, or in our MSDN forum.
 Light
Light Dark
Dark
0 comments