
Get Application Performance Counters of your choice during load runs with Visual Studio Online
Goal of a load testing activity is to identify and fix performance bottlenecks. Visual Studio Online integrates Cloud Load Testing with Application Insights to give deep insights into performance and diagnostics data of your application which dramatically decreases the discovery and resolution of any issues discovered later. This article will walk you through configuring Load Testing to take advantage of Application Insights. With the latest release of Visual Studio Update 3 RC, you will be able to monitor any of the performance counters during the load run.
*Please note that Application Insights is in Preview.
Here are the steps to get started:
- Verify Cloud based load testing with Visual Studio Online is working correctly. Directions can be found here: https://aka.ms/loadtfs
- Make sure you have the latest Visual Studio Updates:
- Download Visual Studio 2013 Ultimate RTM
- Download Visual Studio 2013 Ultimate Update 3 RC
- Configure your application with Application Insights:
Make sure that you apply the workaround mentioned here to send app performance data to Visual Studio Online else your Application will be configured in your Azure subscription and data will be visible only in Azure portal. And if your application is visible in Azure portal then you will not be able to view the performance data during the load run with Cloud load testing (Visual Studio Online).
-
If your application was already configured with Application Insights, then no need to do anything new.
If you want to add custom counters to be monitored during your load run, visit here.
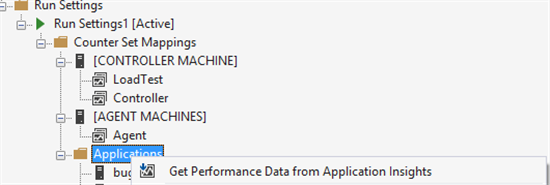
4. Connect the Visual Studio IDE to your Visual Studio Online account from team explorer and open your Load Test. For monitoring application performance counters during the load run:
-
Choose the option of “Get Performance Data from Application Insights”
b. This will retrieve the list of Applications configured with your Application Insights. Please note: In case you have no Applications registered with Visual Studio Online -Application Insights earlier, than you will get a notification of “Nothing is configured for your Visual Studio Online account”. In such a case go ahead and start monitoring your application with Application Insights. Get started with Application Insights.
Choose the counters you want to monitor with the load run:

1 & 2 are for Expand all and Collapse on the Tree structure.
3 is for “Selecting the recommended counters”. In case you are not sure what counters to select to be monitored during the load run, then you can select this option which will select the counters recommended by Cloud load testing service. They include: CPU, Memory, NetworkIO , DiskIO , PerformanceEventsPerSec and ExceptionsPerSecond.
If you are viewing a different modal which shows only the Application names configured with Application Insights, then you need to upgrade your Visual Studio to Update 3 RC. Read the steps mentioned in the starting of this article.
If you want to add more counters including the custom counters to be monitored with Application Insights, kindly visit this post.
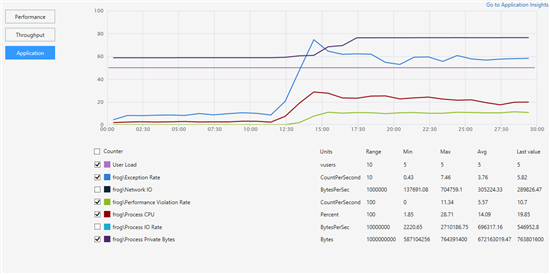
5. On running the load test in cloud – application counters are correlated with the User load on the time axis.
6. Go to Application Insights link and do a Root Cause analysis: To do the detailed root cause analysis of the issue, you can visit Application Insights with the help of a link in the Application Graph.
To learn more about how to do Root cause analysis of the performance issues with Application Insight, please visit: https://aka.ms/aigetstarted
 Light
Light Dark
Dark
0 comments