
Quick IntelliTrace File Open from App Insights
As was introduced in the Details Page Feature Blog, the IntelliTrace Performance Details Page provides to the user thorough information as well as enhanced functionalities for previewing code and debugging. This post will focus on specific IntelliTrace files that are opened from Application Insights portal and the user experience when single performance events are analyzed within Visual Studio.
Start at Details Page for Single Performance Event
When analyzing performance events through Application Insights online, the user has the option of downloading data into a .itrace file to open in Visual Studio locally (for more information on logs, check out Working with IntelliTrace Logs).
Prior to VS2013 Update 3, if the data analyzed in this way contains only 1 single performance event or violation – and no other exception/test data, the log would still show a summary page where the only option was for you to select that single event.

The summary page above is now skipped when only 1 performance violation exists and no other data has been collected. Note that for all other logs which have more than 1 event, the summary page default has not changed.
With VS2013 Update 3, opening a log file with a single performance event takes you directly to the Details Page instead of the Summary Page. This provides a more streamlined workflow and easier navigation.
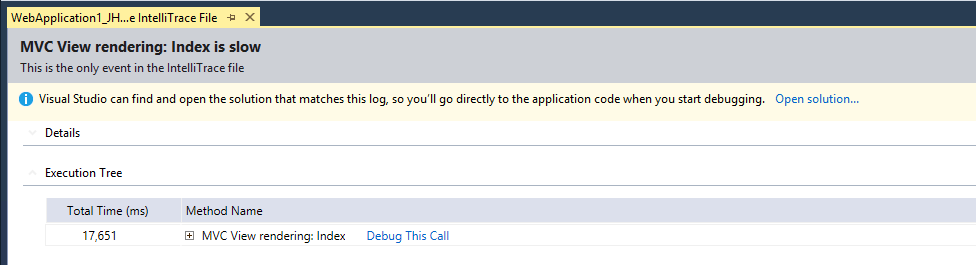
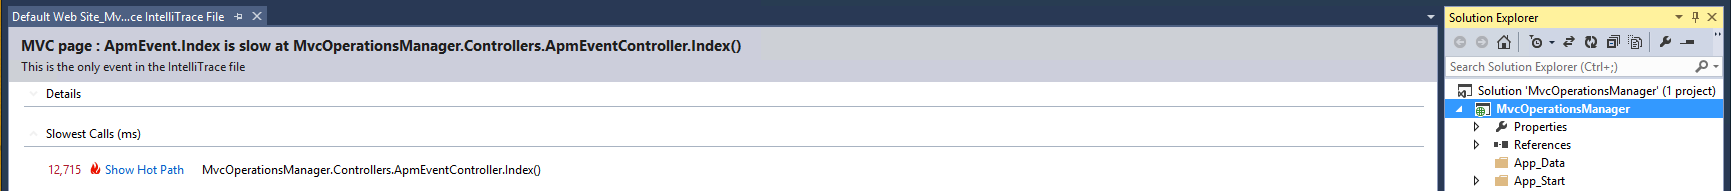
Below, we see the Details Page which is now the default page for analyzing single performance events:
Details Page Functionality
On this enhanced Details page you will see all of the previous features and information as described in the Details Page Feature Blog post but also some new aspects which you’d expect to see on a summary page if there was one:
- System**** Information – the system information previously available only on the summary page is now included in the Details subsection.
- Single Event Indication –“This is the only event in the IntelliTrace file” specifies the default action.****
- Information Bar – the yellow or “gold bar” that displays useful information to the user previously available only on the summary page now has the same functionality on the Details Page. This is mostly used for opening the corresponding solution when the .itrace file contains build information.

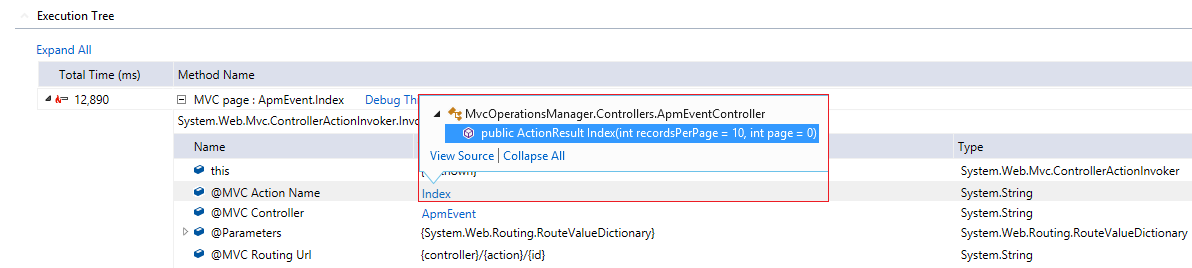
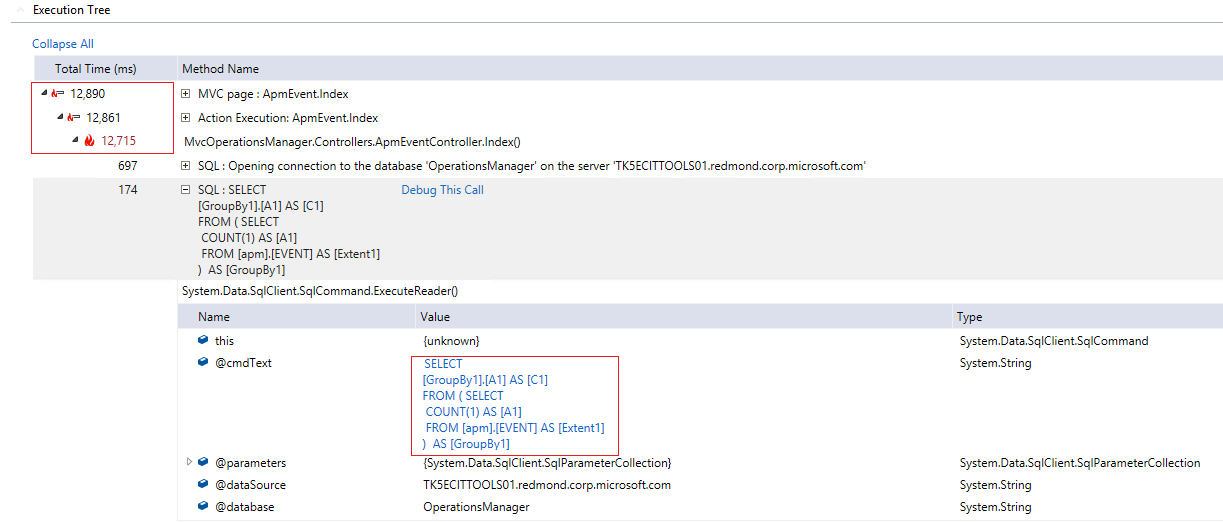
Other Features – all of the features that we have come to enjoy on our Details Page are available to us as well, including MVC Navigation, Jump to SQL, Performance Event Hot Path, and of course the ‘Debug This Call’ action.
MVC Navigation:
Jump to SQL and Performance Event Hot Path:
Showing Log and Opening Solution
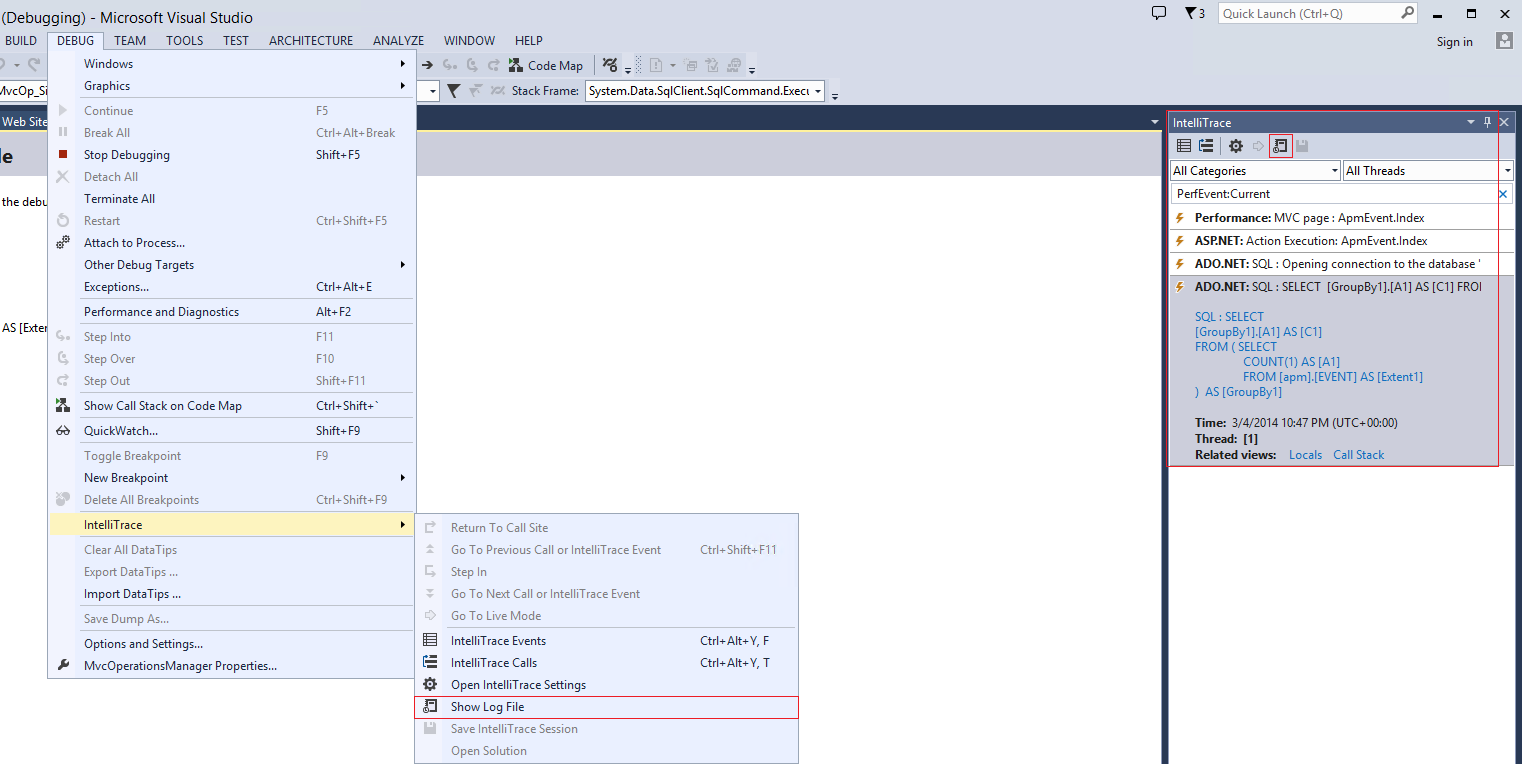
Navigating in and out of the log file has also become easier. Going to the top toolbar and choosing Debug >**** IntelliTrace >**** “Show Log File” **will take the user to the appropriate summary or details page. If debugging has already started, the user can also click the **“Show Log File” button on the IntelliTrace Event Window.
Lastly, opening a solution from the “gold bar” is now page specific – VS remembers what page you opened it from. The past action flow would always return the user to the summary page after opening the solution, in the process closing any and all detail pages that may have been opened prior. This behavior has now been revamped to return the user to the page that the solution was opened from, whether that was the summary or details page.
In Closing
For expanded scenarios and usage information refer to MSDN
We are always looking for feedback and comments for our features. Please visit the MSDN Diagnostics forum
 Light
Light Dark
Dark
0 comments