Application Insights Microsoft Monitoring Agent setup and trouble shooting FAQ
Application Insights has only been available for a month; so it doesn’t come as any surprise that most of the questions and issues have been on the setup process and many of those question has been around the setup of the Microsoft Monitoring Agent. This document should help with the issues we have seen to date.
Installation Issues
- The Account Id and or the Instrumentation Key may have been entered for wrong for the wrong account or the wrong application…Even with the check during the Microsoft Monitoring Agent setup that verifies connectivity I have done this NUMEROUS times!
- Failure with the error: ***“The specified collection plan, version 1.0, is not supported. This installation of Microsoft Monitoring Agent supports collection plan versions from 1.0 to 1.0”. ***Indicates the Microsoft Monitoring Agent has been installed on a non EN-us machine. Changing locale to EN-us, then start monitoring via Powershell using Start-WebApplicationMonitoring and changing locale back to the original language after the monitoring has started should get you around this issue until we update the Microsoft Monitoring Agent. (Should be in our next sprint).
- Remember Application Insights preview does not support: Azure Web Sites, Azure Worker Roles nor Azure Web Roles running on Windows Server 2008.
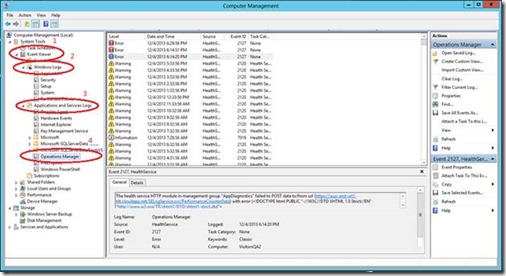
To trouble shoot these issues and more start by looking at the events in the Operations Manager event log(Directions for doing this below). Pay particular attention to APM Agent Event 4003, which is the Start of Microsoft Monitoring agent.
Not seeing any data from the Microsoft Monitoring Agent in Application Insights
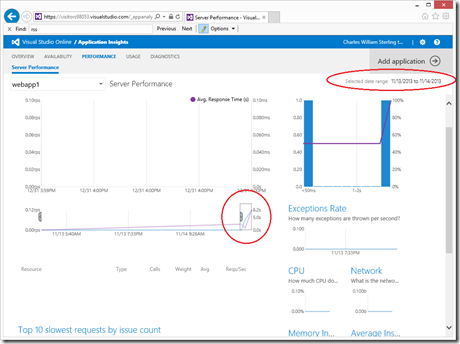
- The largest cause of the problem of not seeing data is people aren’t waiting long enough AND our zoom view makes it easy to initially not see data that is entering the system. In the image below I have two things keeping me from seeing my data: a custom date range and the zoom view. I use Application Insights A LOT and still make this mistake at least once a week.

- An application running in an IIS application pool which already has a monitor or profiler bound to it will cause the MMA to not be able to collect data. For instance a couple of utilities that cause this:
- The .NET Framework SDK ships a utility called TraceLog
- Enabling Intellitrace
- Enabling Auzre profiling
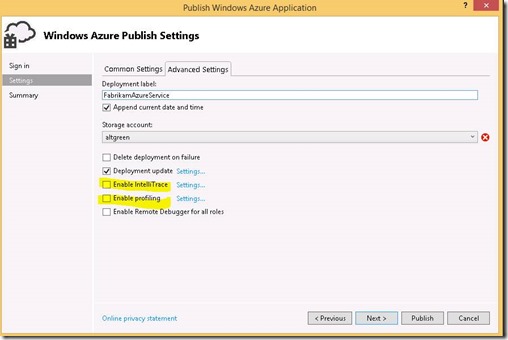
Luckily the solution is easy: either turn off these utilities or run the application you want to monitor under an Application Pool that does not have Tracelog/another profiler/agent enabled. Unfortunately there isn’t an easy way to see if this causing your problem…So either look into the event log (see above) or simply create a new Application Pool and run your application in this Application Pool.
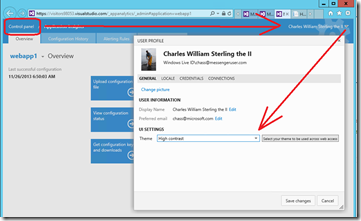
3. If you have the same time range but are seeing different data sets for the same application it is likely you have you Visual Studio Online profile to use “high contrast”…We are working on solving these issues for Application Insights in our next sprint!
4. The application being monitored isn’t seeing any traffic. The application needs to be getting traffic as we won’t produce data if the application pool is not running.
5. (related to above) The traffic is going to the wrong web application. Remember Visual Studio defaults to running applications in IIS Express (which we don’t monitor) and your requests can easily be redirected! To work around this try generating load using Localhost.
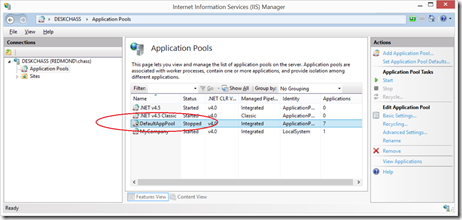
6. If the IIS Application Pool recycling threshold was set too low and IIS gets into a loop of recycling it the Application pool will be disabled. As stated above the application needs to be getting traffic – we won’t produce data if the application pool is down. During debugging sessions this is a pretty common issue!
7. For services running asynchronously remember exception data will often be delayed.
8. If Microsoft Monitoring Agent is in a compromised or non responsive state it will stop sending data and may need to be restarted. To restart Application Insight services please restart the following local services (see directions below):
- Microsoft Monitoring Agent
- Microsoft Monitoring Agent APM
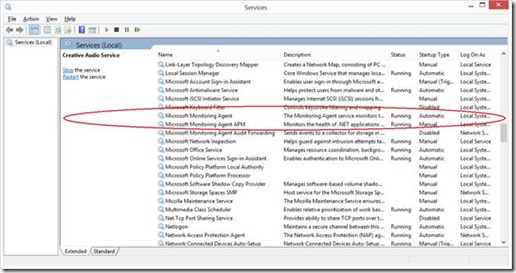
Directions for checking for events in the Operations Manager event log
- Open Computer Management
- In Windows 7 and Windows Server 2012, Open Administrative Tools by click on Control Panel. In the search box, type administrative tools, and then click Administrative Tools. Then go to Computer Management and double click on it.
- In Windows 8.1, you can right-click on the start menu, and choose Console Management.
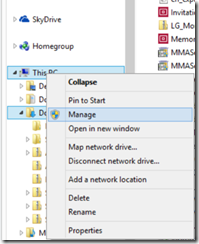
- On either Windows 7 or Windows 8 right click on the My Computer/This PC and choose “Manage”
3. Expand the Event Viewer folder, the Windows Logs folder, the Applications and Services Logs folder then click on the Operations Manager icon.
Restarting the Microsoft Monitoring Agent Services
- On Windows 7 and Windows Server 2012, open the Control Panel (in icons view), click on the Administrative Tools icon, and click on Services.
- On Windows 8, go to the Start Menu and search for “View local services”.
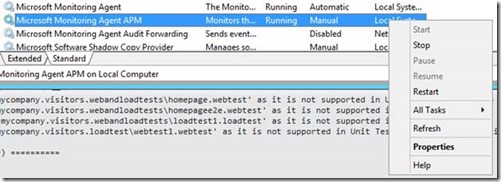
- Scroll down until you see the entries “Microsoft Monitoring Agent” and “Microsoft Monitoring Agent APM.”
- For each, right click and select “restart”.
Microsoft Monitoring Agent event log Event IDs
Since most trouble shooting of the Microsoft Monitoring Agent will involve looking at the event log: enclosed below is a list of both Application Insights and other services Event IDs to help you trouble-shoot issues you may encounter.
|
Event ID |
Event Source |
Severity |
Issue |
|
34203/34207 |
.NET app monitoring |
Informational |
Application was removed from monitoring (IIS Recycle/Restart required) |
|
34204/34208 |
.NET app monitoring |
Informational |
Application was added to monitoring (IIS Recycle/Restart required) |
|
34205/34209 |
.NET app monitoring |
Informational |
Application settings have been updated (IIS Recycle/Restart required) |
|
34206/34210 |
.NET app monitoring |
Informational |
Application Exception monitoring settings have been changed (IIS Recycle/Restart required) |
|
34212 |
.NET app monitoring |
Warning |
Web application being monitored has conflicts in configuration. Monitoring is disabled |
|
34214 |
.NET app monitoring |
Informational |
Configuration successfully applied |
|
34215 |
.NET app monitoring |
Error |
Configuration contains errors. Application monitoring failed to start |
|
34216 |
.NET app monitoring |
Informational |
Configuration successfully applied. Some non-critical conflicts detected |
|
34217 |
.NET app monitoring |
Informational |
Configuration processing has started |
|
34218 |
.NET app monitoring |
Informational |
Configuration processing is completed |
|
34219 |
.NET app monitoring |
Informational |
System Center Management APM service is running |
|
34220 |
.NET app monitoring |
Error |
Unrecoverable error during processing of configuration |
|
34229 |
.NET app monitoring |
Informational |
Write Action configuration infrastructure has stopped |
|
34221-34239 |
.NET app monitoring |
Error |
Different errors from the configuration processing system |
|
4003 |
APM Agent |
Informational |
Microsoft Monitoring Agent started successfully |
|
20000 |
Health Service Script |
Informational |
IIS was successfully restarted |
|
4151 |
APM Agent |
Error |
Microsoft Monitoring Agent is not running |
|
1317-1318 |
APM Agent |
Error |
Namespace collection disabled (not strictly a failure; effect of optimization – but can prevent you from seeing expected data) |
|
4139-4140 |
APM Agent |
Informational |
Configuration files have been modified and reloaded |
|
4149-4150 |
APM Agent |
Informational |
Performance counters are being collected |
|
1111 |
APM Agent |
Informational |
Shut down of Microsoft Monitoring Agent has occurred |

 Light
Light Dark
Dark
0 comments