
Conditional Breakpoints
This blog post is part of a series on breakpoints in the Visual Studio debugger and has been updated to reflect the experience of using Visual Studio 2015. If you are interested in details about setting conditional breakpoints using earlier versions of Visual Studio please see the MSDN documentation.
In earlier posts, we showed hit count breakpoints and filter breakpoints , which both help a developer narrow down the scenarios in which a breakpoint it hit. A conditional breakpoint does the same, but it offers more flexibility by allowing the developer to customize the condition with any valid expression.
We will illustrate one way conditional breakpoints can be used, we will use our C++ example. We’ve noticed that we have a memory leak in this application, and we will use conditional breakpoints to help track it down.
Our application uses AddRef and Release and so an object is leaked when the program calls AddRef on an object more times than it calls Release. We will track this down by tracing the AddRef and Release functions with tracepoints.

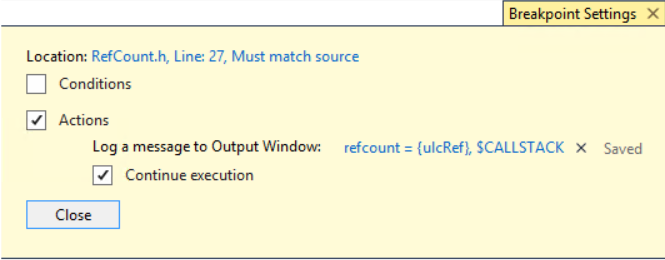
At each of these tracepoints, we will print out the value of ulcRef as well as the current call stack.
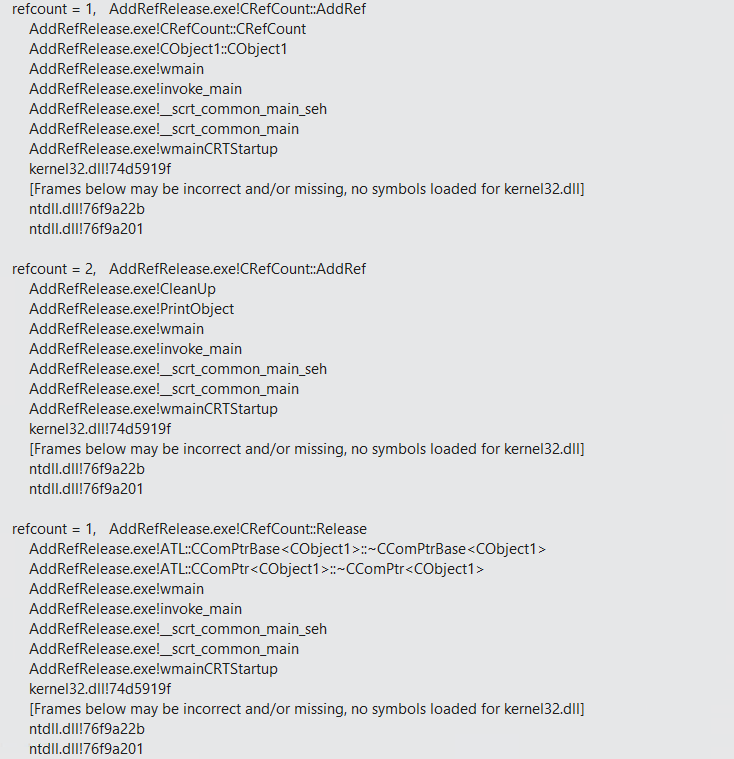
Now when we run the application we get the following output.
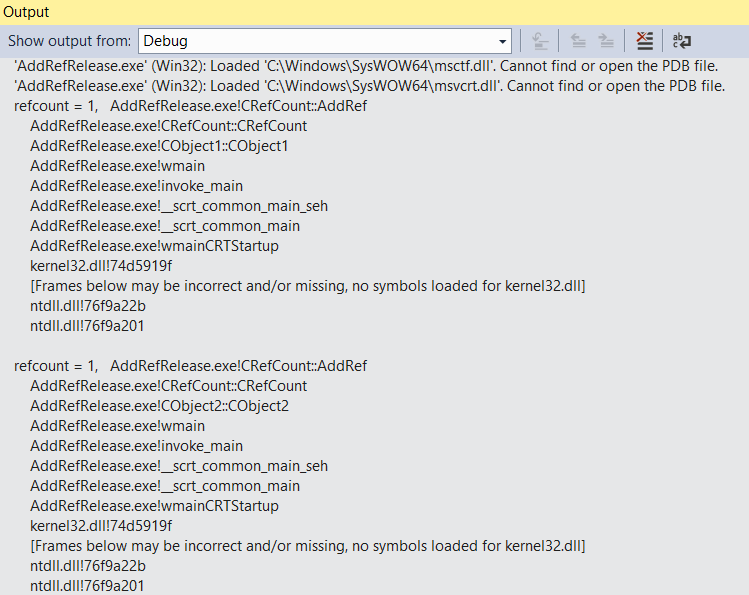
Without even getting past the second tracepoint output, we can see that we have too much information here. We see two calls to AddRef that both have a refcount of 1. This is because we are seeing output for all objects being AddRef’d.
To narrow this down, we will set a condition on this tracepoint so that we only see this output for the object being leaked.
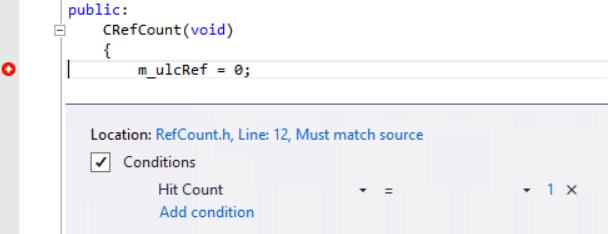
To get started, first we need to get the address of the object being leaked. We do this by setting a breakpoint on the constructor. In this case, we will set a hit count breakpoint because we only want to hit this exactly once.
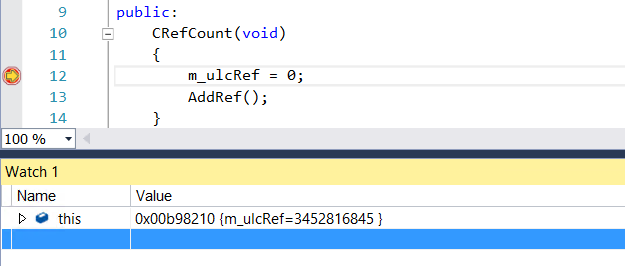
When we hit this breakpoint while debugging we now have the address of the leaked object.
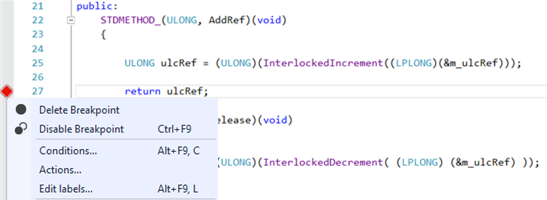
Then we can go back to our tracepoints and add a condition. To do this we hover over the tracepoint to bring up the tracepoint’s toolbar and click the “Settings…” icon.

You can also right-click on the tracepoint to bring up the context menu and click “Conditions…” or use the keyboard shortcut Alt+F9, C
Then select “Conditions” and set the conditional expression to match the value of “this” that you inspected at the constructor. (Tip: Using the context menu or shortcut key will open the window with the Conditions box already checked.)

Create the same condition for both tracepoints. Now when you continue the execution, you can see the output just for that object in the Output window.
It is now easy to see that the object has 2 AddRef and only 1 release. Based on the call stack, the release is coming from the destructor, which matches the first AddRef called by the constructor. This leaves the AddRef of the CleanUp function as the extra one that needs to be removed (or paired up with some Release call) to fix the leak.
 Light
Light Dark
Dark
0 comments