
Debugging Unhandled Exceptions in a SharePoint App with Visual Studio using IntelliTrace
Following on from our last blog post on IntelliTrace enhancements for SharePoint, in this blog post we’ll talk about how the new analysis section for SharePoint can help you find the source of issues faster.
The New Analysis Section
IntelliTrace is very good at providing a lot of data to you for debugging, but there is such a thing as “too much” data. When a lot of information is available, it can be hard to figure out what to look for and how to find it. To help you pinpoint bugs more quickly, we’ve added an Analysis section to the IntelliTrace Summary Page, which is the first thing that you will see when you open an IntelliTrace log. This new section strives to be “smart” about the data it presents; that is, it will point you towards places in your code that are likely to contain bugs. The Analysis section is populated by analyzing the log (hence the name) to look for the specific patterns and events that indicate problems.
In Update 1, the analysis section is focused squarely on highlighting unhandled exceptions in SharePoint applications.
An exception is considered “unhandled” in a SharePoint (and ASP.NET) application if it has propagated to the global exception handler. Such an exception in a SharePoint application usually results in a rather cryptic error page:
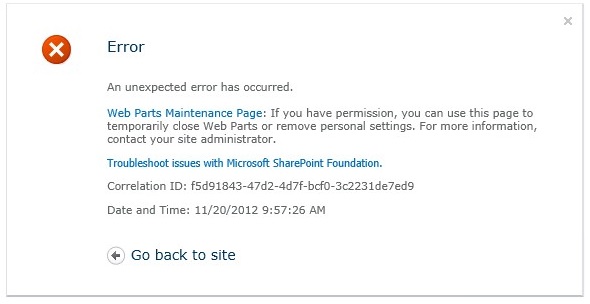
…which doesn’t contain much information at all. Such errors are severe enough that they are almost never considered “normal” behavior. Hence, Visual Studio will aggregate occurrences of such unhandled exceptions into the Analysis section when it encounters them in an IntelliTrace log, so that you can start debugging them directly from the summary page.
Walkthrough
In the following walkthrough, we will debug a SharePoint page that contains such an unhandled exception, and use the new Analysis section to quickly get to the relevant piece of code. You may recall the example from our last IntelliTrace
with SharePoint blog post.
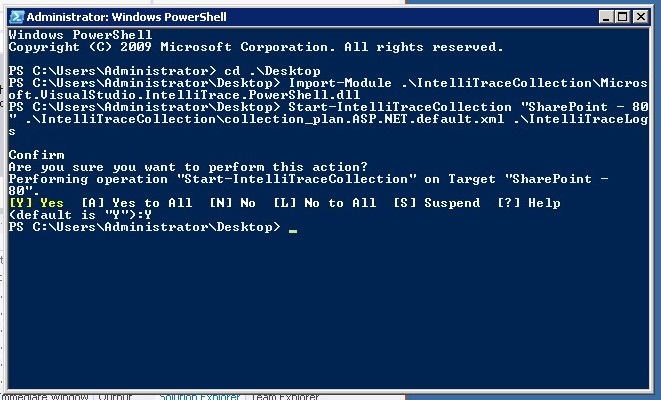
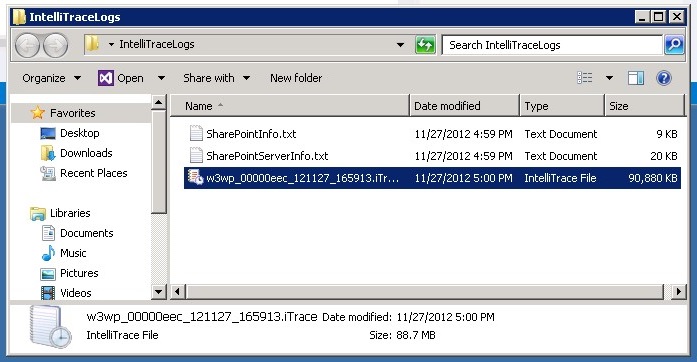
First, start collecting on the App Pool that contains the SharePoint application. Specifically look at steps 1-4 in the ‘How do I get started’ section. In this example the App Pool is called “SharePoint – 80”, we used the default collection plan, and we told IntelliTrace to put collected logs into a folder called “IntelliTraceLogs” on the Desktop:
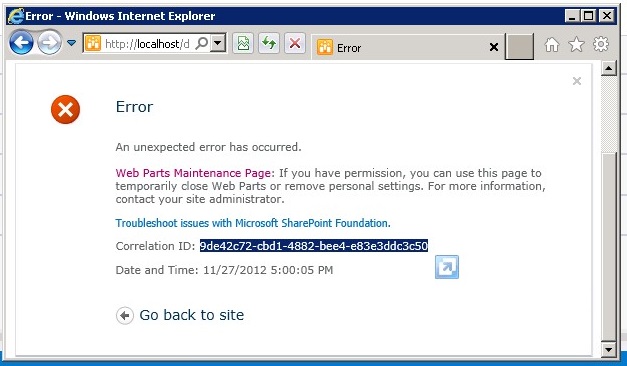
Then, navigate to the SharePoint site to get the error page. Note the Correlation ID:
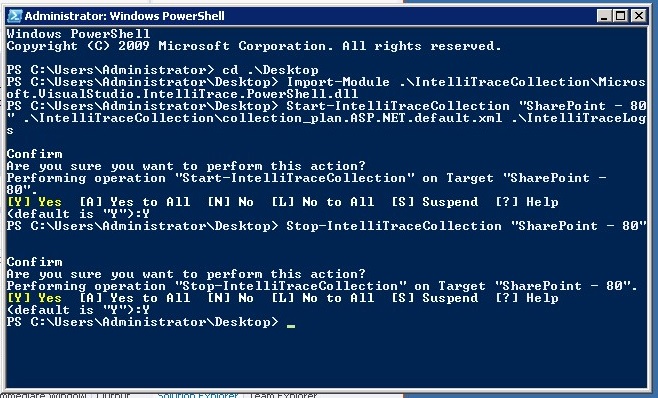
After the page finishes loading, stop collecting on the App Pool:
Now we navigate to the “IntelliTraceLogs” folder and open the IntelliTrace log:
Visual Studio will display the IntelliTrace summary page upon opening the log:
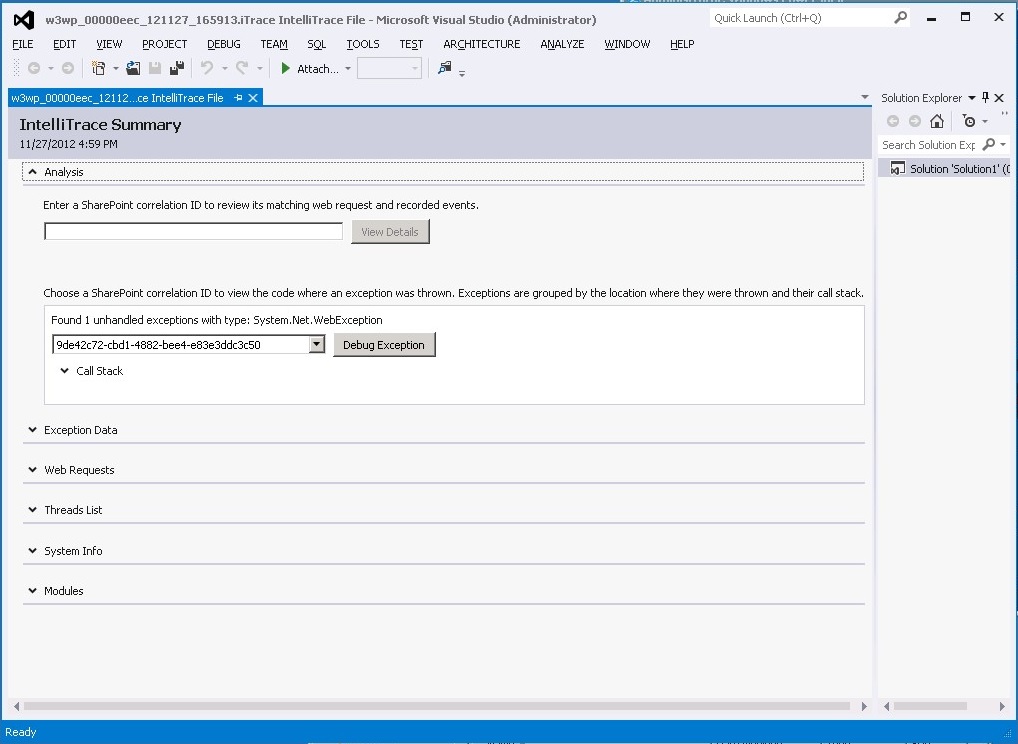
Note that the analysis section here has a list with an item that tells you that IntelliTrace has “found 1 unhandled exception(s) with type: System.Net.WebException”. The item in this list represents all the unhandled exceptions with this type and the same call stack, as the page explains. Also note that the Correlation ID in that drop-down box is identical to the one found on the error page.
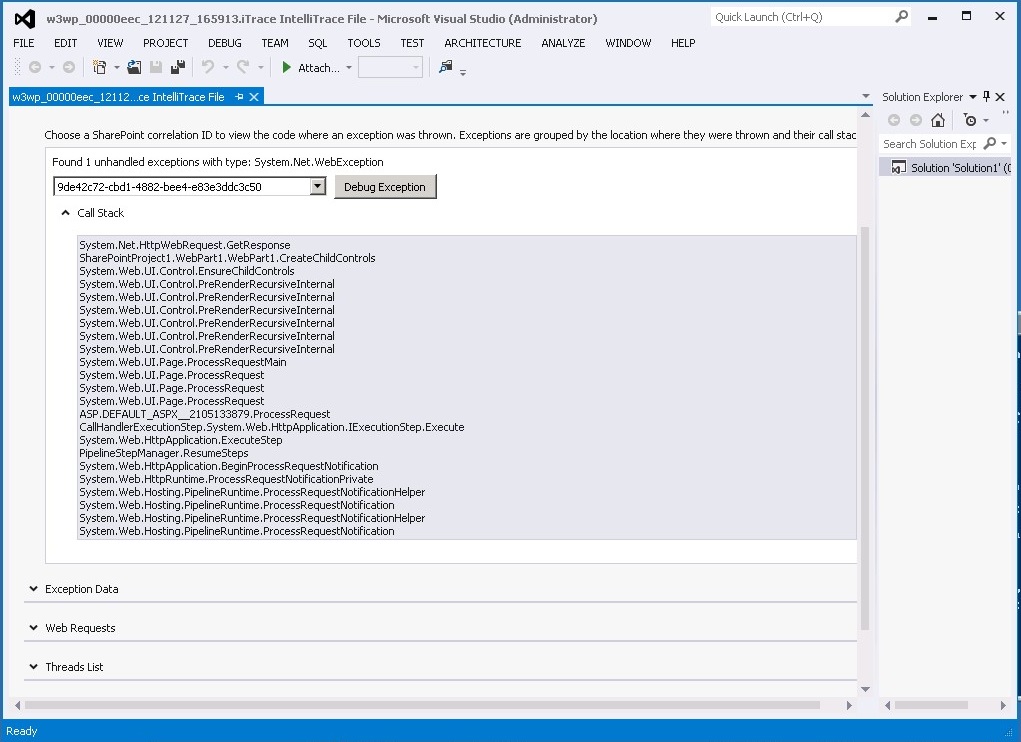
At this point, we can expand the Call Stack to determine the method in which this exception was thrown, and the sequence of method calls that led up to it:
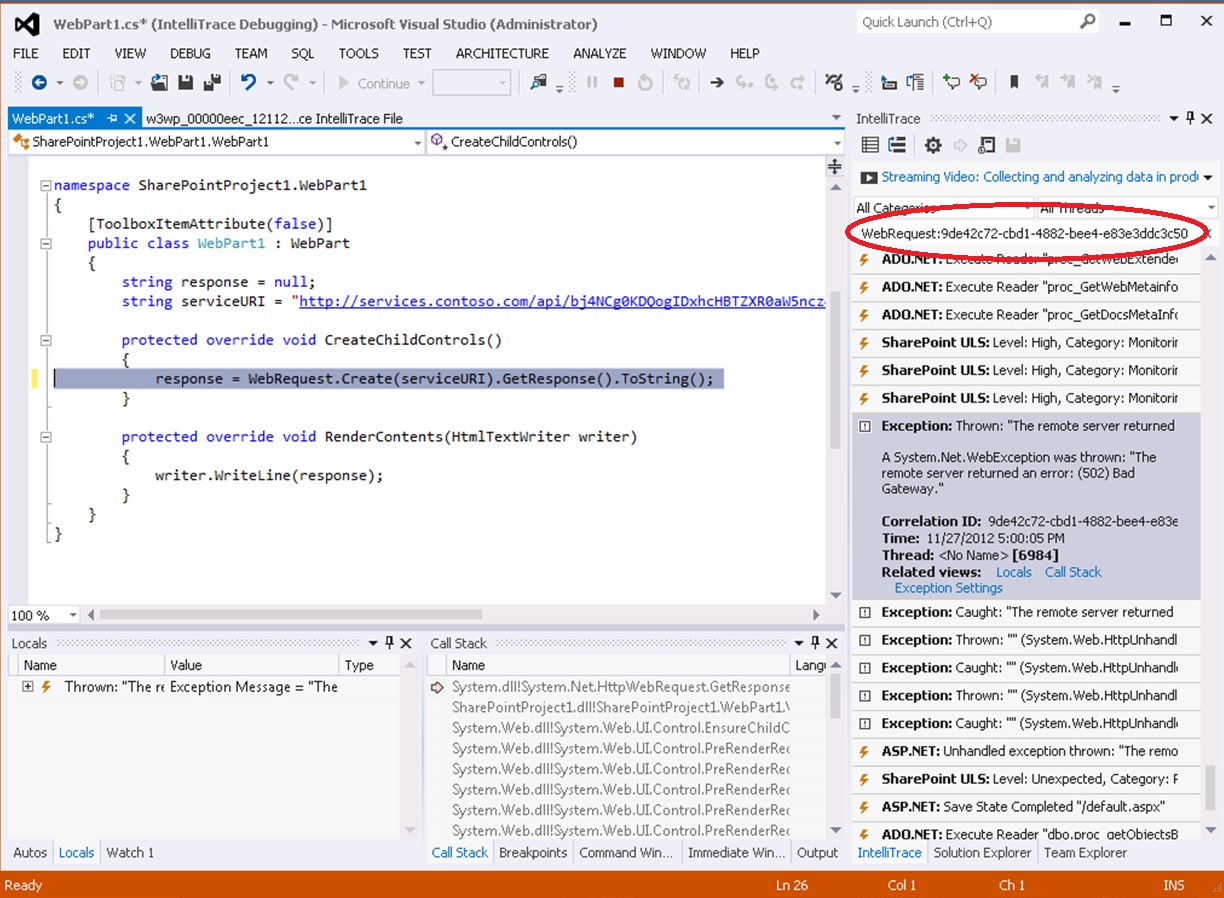
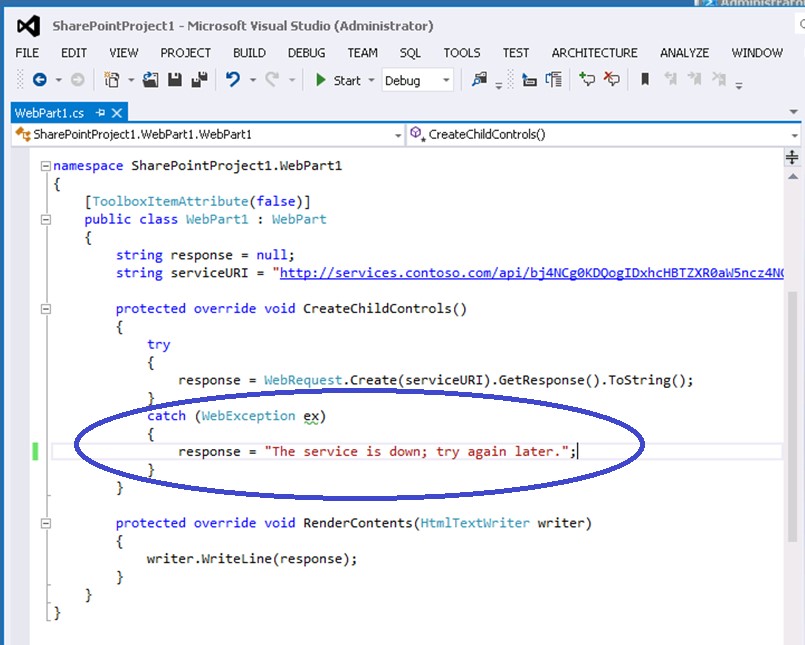
 To go to code, just click “Debug Exception”. This will bring you to the place where the exception was thrown:
Note: If you see the message “Symbols not found”, Visual Studio can’t resolve the source locations. Make sure the application’s symbol (.pdb) files are in the Visual Studio symbol path. See Find symbol (.pdb) files and source files.
Here is a zoomed in screenshot of the relevant portion from the IntelliTrace window:
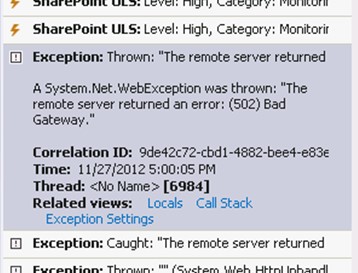
Note that the IntelliTrace window has been filtered to show only events in the web request that threw the unhandled exception. The string “WebRequest:9de42c72-cbd1-4882-bee4-e83e3ddc3c50” indicates that the list has been filtered to the web request that was assigned that specific Correlation ID (the same one in our error page and in the drop-down list) by SharePoint.
It seems that the service we were trying to use was down. Maybe it’ll come back later. The fix is easy: just catch the exception and display a notification message informing users about the situation:
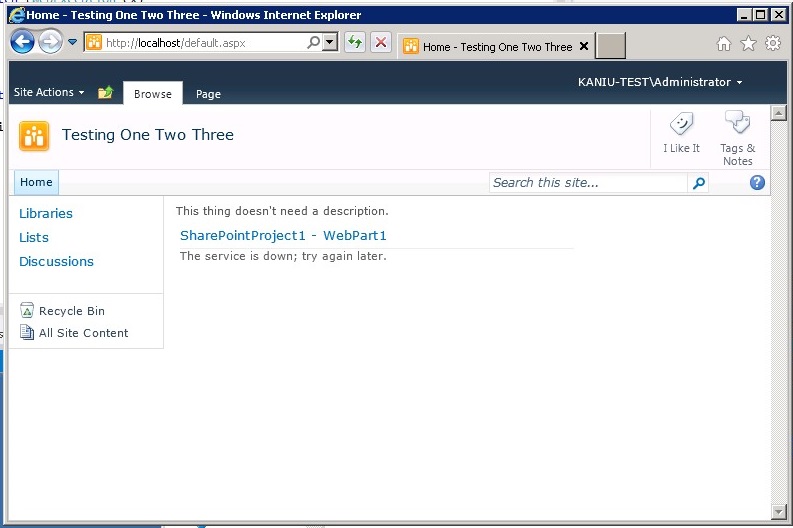
After re-deploying, our page now works just fine:
Conclusion
The Analysis section makes it possible to skip many tedious steps when debugging bugs caused by unhandled exceptions. Compare the single click needed here to go to code with the manual analysis done in the previous post.
If you have ideas or suggestions, leave them in the comments below. We appreciate your feedback!
 Light
Light Dark
Dark
0 comments