
Optimizing IntelliTrace Collection on Production Server
Introduction
Visual Studio 11 introduces a standalone IntelliTrace package which can be downloaded and copied to a product server and used to collect IntelliTrace information such as call events, web request, exceptions, etc.
One of the key factors to consider for turning on IntelliTrace collection is the performance cost in terms of CPU, memory usage and page response time. This article will discuss the performance measurements we took in Microsoft and recommend ways to tune IntelliTrace performance on production sever.
IntelliTrace Instrumentation Mode
With Visual Studio 11, there are three IntelliTrace instrumentation modes.
- DiagnosticEventInstrumentation
This will collect IntelliTrace Events such as ADO.net, ASP.net events. This is equivalent to “IntelliTrace Events Only” in Visual Studio UI.
- WebTrackingInstrumentation
This newly introduced feature will collect web request information on a production server. This can only be enabled in the standalone package.
- TraceInstrumentation
This will collect call information, also known as IntelliTrace High. This could potentially have the greatest performance impact but will also provide the most diagnostic information. This is equivalent to “IntelliTrace Events and Calls” in Visual Studio UI.
These instrumentation modes can be turned on/off by modifying the collection plan. For example, the following segment of the collection plan will turn on DiagnosticEventInstrumentation but turn off WebTrackingInstrumentation and TraceInstrumentation.
|
Visual Studio 11 standalone IntelliTrace package includes two collection plans by default:
- collection_plan.ASP.NET.default.xml
This collection plan turns on diagnosticEventInstrumentation and WebTrackingInstrumentation but turns off TraceInstrumention. This is also called IntelliTrace Low mode.
- collection_plan.ASP.NET.trace.xml
This collection plan turns on all three modes of IntelliTrace collection. This is also called IntelliTrace High mode.
These collection plans can be modified to suit individual needs
Performance Impact for IntelliTrace Low
When using IntelliTrace in low mode, our tests show ~15% slower page response time across different loads.
The table below shows the data we collected for the performance impact in terms of CPU usage and average page time for IntelliTrace in low mode.
|
|
32 users |
|
64 users |
128 users |
|||||
|
|
Off |
Low |
%delta |
Off |
Low |
%delta |
Off |
Low |
%delta |
|
%CPU w3wp.exe |
15.00% |
17.60% |
-17.33% |
28.60% |
33.40% |
-16.78% |
50.60% |
59.10% |
-16.80% |
|
Avg. Page Time(s) |
0.65 |
0.74 |
-13.85% |
0.72 |
0.82 |
-13.89% |
0.78 |
0.89 |
-14.10% |
There will also be a memory cost for turning on IntelliTrace since pre-generated native images cannot be used. This memory cost typically happens at the start-up time when modules are loaded and will not increase during the life of the web application. The actual amount of memory increase is related to the number of modules being loaded by the application. For example, the memory increase is about 60M for a simple test web application and 200M for a complex application such as Microsoft Team Foundation Server.
Performance Impact for IntelliTrace High
The performance cost for turning on IntelliTrace in high mode depends on the following factors:
1. IntelliTrace injects code to the instrumented methods and will slow down the execution
IntelliTrace collects information for every call to every method in modules that are included for instrumentation. So the performance of your application will be directly related to the number of times that these methods are called. If you supply an assembly that has methods that called often in a tight loop, this will likely cause a larger performance impact than if you assembly has a lot of methods that are called sporadically.
2. File I/O bottleneck
IntelliTrace buffers data before writing to disk in order to improve responsiveness. However, if there is a lot of data to write, and the disk is slow to respond, these buffers can be filled, forcing IntelliTrace to suspend the work process to wait for the disk, slowing performance. In our lab, we have observed a data writing throughput limit of 20M/sec on average. This number may vary depending on the machine configurations.
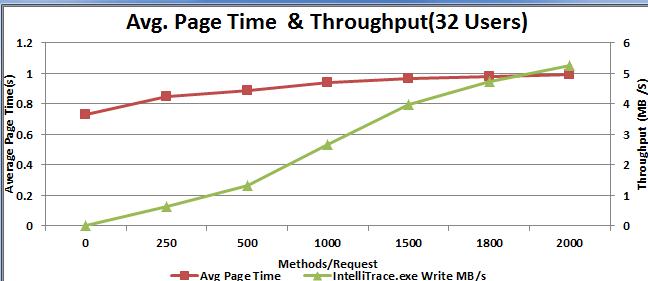
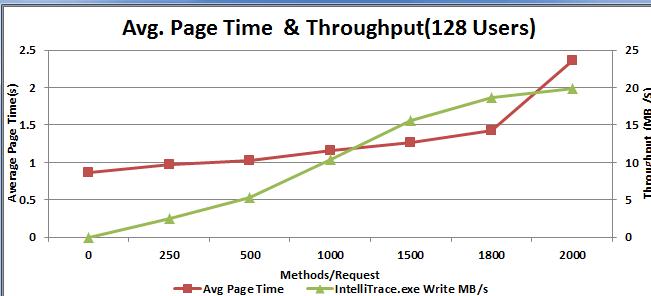
In our performance test, only one module which contains one method is enabled for IntelliTrace collection. As the result, we can control how many times this method is called per page request. The graphs below show the slowdown of page response time in relation to the number of instrumented methods being executed and throughput of IntelliTrace data being written. In the second graph, you can see the performance degrades greatly when IntelliTrace throughput reaches 18M/s.
Recommendations for tuning IntelliTrace in High Mode
IntelliTrace in high mode provides call information. This can be very helpful in tracking down some hard to reproduce problems. But it needs to be done very selectively so that the web application does not slow down too much.
1. Only target very few selected modules
Hopefully you have an idea on which area that error most likely happened. You can then modify the collection plan to enable TraceInstrumentation only for the affected modules.
The collection_plan.ASP.NET.trace.xml shipped with the package has the following lines:
|
|
This basically means to exclude the modules that start with “Microsoft” and modules with publicKeyToken listed in the list (Those are IntelliTrace modules) .
To enable instrumentation for only the module you wanted, modify the above section as the following:
|
|
This will enable instrumentation for MyDataAccess.dll and all the modules that start with MyWebAppdll. Notice you use “MyWebAppDll.” Not “MyWebAppDll.*”
Tuning the enabled modules by monitoring performance counters such as CPU usage and disk/IO to make sure the web application’s performance is acceptable.
2. Modify the maximum log file size to suite your need.
IntelliTrace places a limit on the file size for its log file. This maximum file size can be configured as part of the collection plan. The default size is 100M. When the maximum file size is reached, IntelliTrace employs a circular truncation mechanism in which the earlier events are truncated. As the result, the useful IntelliTrace information could be truncated if the maximum file size is set to small. If you know byte/s written by the IntelliTrace, you can estimate the maximum log file size needed for your collection and set it accordingly. However, it is recommended that maximum log file size does not exceed 1G as it could be potential slow for Visual Studio to read back a very large IntelliTrace log file.
 Light
Light Dark
Dark
0 comments