Performance Improvements for the Concurrency Visualizer
Downloading Symbols
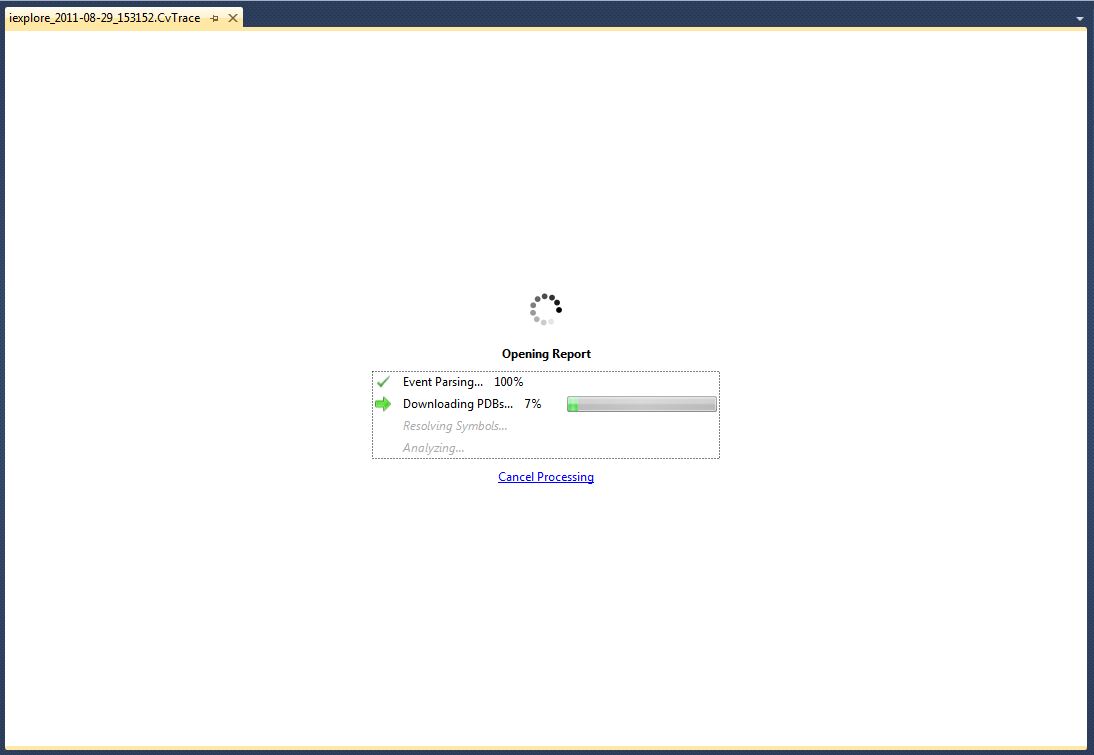
As mentioned in https://blogs.msdn.com/b/visualizeparallel/archive/2011/09/19/how-can-visual-studio-11-developer-preview-visualize-the-behavior-of-a-multithreaded-application.aspx there are noticeable performance improvements to the Concurrency Visualizer in Visual Studio 11 Developer Preview. One source of the performance improvements is that it uses the fastest code, i.e., the fastest code is code that never runs. When the Concurrency Visualizer is opening the trace files generated by Event Tracing for Windows, it has four visible stages in the profile progress view. The first stage parses the ETW events and filters out events which aren't needed. Then it downloads PDB files but only for assemblies which were loaded by the process being traced, whereas previously all of the assemblies which had events in the ETW trace were PDB files being requested for them.
Another performance improvement in requesting PDB files, is that previously the PDBs were being requested serially. Now the set of PDB files to find are being requested concurrently.
Caching Results
Another noticeable reduction in the amount of time required to open a trace is that reopening one is nearly instantaneous. When reopening a .vsp file in Visual Studio 2010 the app.ctl and krn.ctl files are reparsed, and symbols for the assemblies are requested again. Whereas when the Concurrency Visualizer analyzes the kernel.etl and user.etl files in Visual Studio 11 Developer Preview, it generates a cache file of its results; so when the CvTrace file (the new file type generated by the Concurrency Visualizer) is reopened, it reads from the cache and doesn’t need to reparse the .etl files.
Scalability
The Visual Studio 11 DP Concurrency Visualizer can handle noticeably larger traces and still maintain a responsive UI. The two primary limits on what might overwhelm the Concurrency Visualizer are the duration of the trace and the number of threads which existed during the duration of the trace. The Concurrency Visualizer has been tested with hour long traces, and traces where the application generated 40,000+ threads (by the way, if your process is creating 40,000 threads and it’s not running on a computer with ~40,000 cores, you’re doing it wrong). The Concurrency Visualizer remains responsive for the vast majority of traces it visualizes. Though, it's always good practice to keep the trace as small as possible when investigating issues.
Conclusion
Try out the Concurrency Visualizer in Visual Studio 11 Developer Preview. The performance improvements which have gone into it lessen the time from compile to the time for insight and keep the UI more responsive, making it a much sharper tool in the professional developers’ tool belt.