Profiling DirectX Activity
In Visual Studio 11 Developer Preview the Concurrency Visualizer highlights the way the traced process makes use of DirectX. To see how Internet Explorer 9 makes use of the GPU give the HKEY_CURRENT_USER\Software\Microsoft\Internet Explorer\Main\TabProcGrowth registry key a value of 0. Internet Explorer will then only use one process per window. Navigate Internet Explorer to a website which takes advantage of the graphics card; I chose https://ie.microsoft.com/testdrive/Performance/Paintball/Default.html. In Visual Studio 11 Developer Preview attach the Concurrency Visualizer to Internet Explorer by selecting Analyze -> Concurrency Visualizer -> Attach to Process …, then in the Attach to Process dialog box select the single iexplore process, and then press to Attach button.
Once the collection window starts reporting the size of the trace files on disk, press the arrow in Internet Explorer to start the paintball exercise. When the painting has completed, and it is showing the performance results, close Internet Explorer. The resulting CPU Utilization view may look like this:
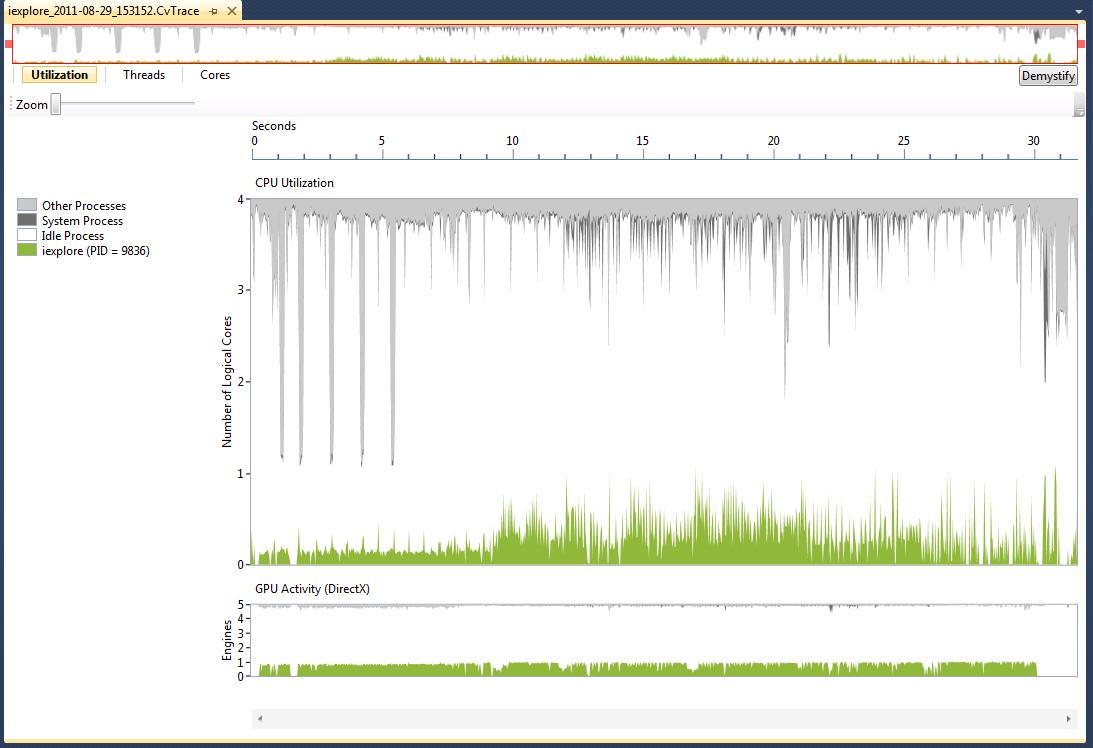
Take note of the GPU Activity (DirectX) pane beneath the CPU Utilization. Switching over to the Threads View I have hidden all of the swim lanes, except the swim lane for the GPU Adapter and the Worker Thread I suspect was driving the painting process.
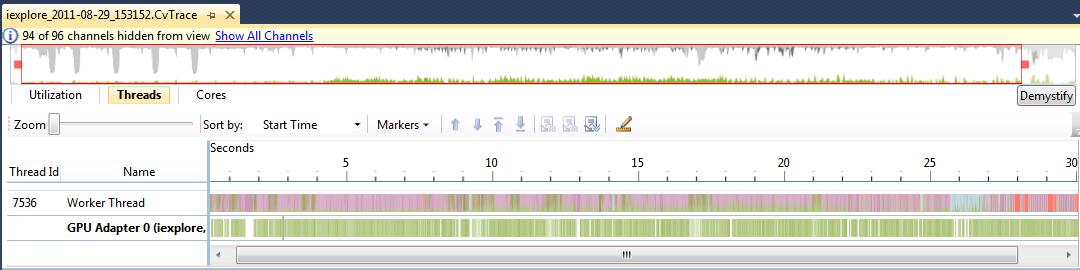
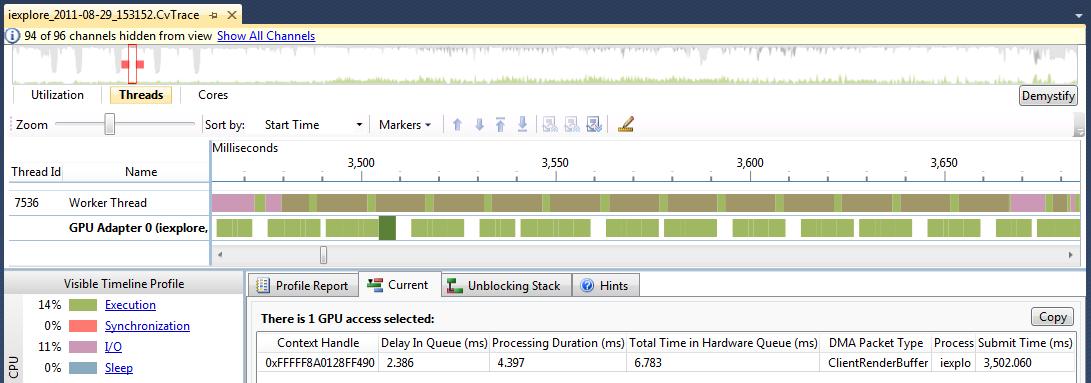
In the GPU Adapter lane there are green segments representing work sent through DirectX to the GPU and there are blank spaces where no work was being sent. So during the time that Internet Explorer was testing out the performance of the graphics card on the computer, it didn't really leave the GPU idle. Zooming in, I can see a pattern that looks like a relationship between the thread and the GPU. Clicking on one of the segments in the GPU swim lane I can get information about what was happening during that segment. Information like the total time it was in the hardware queue and the length of its processing duration.
Being able to visualize when the GPU adapter is doing work, or knowing how long the delays are when too much work is being offloaded to the GPU, is very valuable for the developer of a C++ AMP application who wants to know if the GPU is the bottleneck of their algorithm. Being able to see the GPU work alongside the CPU work is one of the many improvements to the Concurrency Visualizer in Visual Studio 11 Developer Preview.