I know I’m doing more File I/O than this
One of the changes made to the Concurrency Visualizer in Visual Studio 11 Developer Preview is that it no longers shows all of the disk I/O activity for the System process in the disk I/O swim lanes. In Visual Studio 2010 the disk I/O swim lanes had I/O segments for all of the disk I/O for the process being traced and the System process. For many performance investigations this can be overtly noisy because System does a lot of disk I/O which wouldn’t be related to the process being traced. In Visual Studio 11 Developer Preview the disk I/O swim lanes have I/O segments for just the files which the process being traced has file handles for. This does mean that there will be I/O segments from other processes, but they have to be doing disk I/O while the traced process has a file handle open for the file.
I have an application I’m developing called PhotoAlbumWorkflow. It applies metadata tags to pictures which don’t have the desired metadata. The relevant code is here:
using (System.IO.FileStream fs = new System.IO.FileStream(fileName, System.IO.FileMode.Open, System.IO.FileAccess.ReadWrite))
{
BitmapDecoder decoder = BitmapDecoder.Create(fs,
BitmapCreateOptions.None,
BitmapCacheOption.OnDemand);
InPlaceBitmapMetadataWriter bitmeta = decoder.Frames[0].CreateInPlaceBitmapMetadataWriter();
bitmeta.TrySave()
Taking a trace with the Concurrency Visualizer in Visual Studio 11 Developer Preview, of PhotoAlbumWorkflow applying metadata for all of the files in a directory, I would expect to see a read operation followed by a write operation, sequentially for every file in the directory. For example, if all of the files in the directory have the same prefix (Technical) and then a unique number; I would expect the trace to show that PhotoAlbumWorkflow.exe performed a read operation on Technical 01.jpg, followed by a write to Technical 01.jpg, followed by a read on Technical 02.jpg, followed by a write on Technical 02.jpg, etc. But that’s not what the trace shows at all.
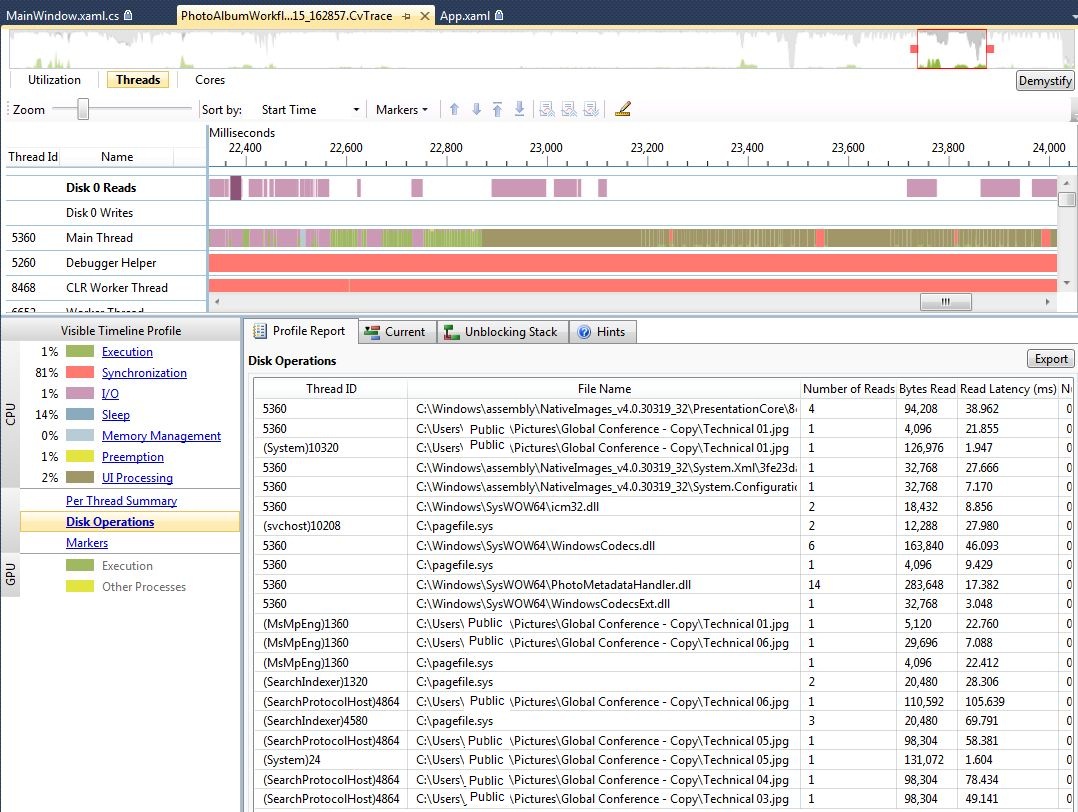
Having zoomed into an area in the Threads View where Disk I/O occured, I opened the Disk Operations profile report, to find that the only disk I/O PhotoAlbumWorkflow did was a read for Technical 01.jpg. What’s equally bizarre is that even without PhotoAlbumWorkflow doing disk I/O against Technical 02 - 06, processes like MsMpEng (Microsoft Forefront) and SearchProtocolHost are performing disk I/O against those files. According to the Disk Operations report PhotoAlbumWorkflow isn’t even doing a single write. What’s going on? I know that PhotoAlbumWorkflow has to be doing more file I/O than this.
Thread ID |
File Name |
Bytes Read |
Bytes Written |
5360 |
C:\Windows\assembly\NativeImages_v4.0.30319_32\PresentationCore\8cd6af3692d39ff75274cbbe5fbd7286\PresentationCore.ni.dll |
94208 |
0 |
5360 |
C:\Users\Public\Pictures\Global Conference - Copy\Technical 01.jpg |
4096 |
0 |
(System)10320 |
C:\Users\Public\Pictures\Global Conference - Copy\Technical 01.jpg |
126976 |
0 |
5360 |
C:\Windows\assembly\NativeImages_v4.0.30319_32\System.Xml\3fe23da10c236ec93a840ff5ddc0d847\System.Xml.ni.dll |
32768 |
0 |
5360 |
C:\Windows\assembly\NativeImages_v4.0.30319_32\System.Configuration\48dc3c4886c05d65373f3ce312039f6f\System.Configuration.ni.dll |
32768 |
0 |
5360 |
C:\Windows\SysWOW64\icm32.dll |
18432 |
0 |
(svchost)10208 |
C:\pagefile.sys |
12288 |
0 |
5360 |
C:\Windows\SysWOW64\WindowsCodecs.dll |
163840 |
0 |
5360 |
C:\pagefile.sys |
4096 |
0 |
5360 |
C:\Windows\SysWOW64\PhotoMetadataHandler.dll |
283648 |
0 |
5360 |
C:\Windows\SysWOW64\WindowsCodecsExt.dll |
32768 |
0 |
(MsMpEng)1360 |
C:\Users\Public\Pictures\Global Conference - Copy\Technical 01.jpg |
5120 |
0 |
(MsMpEng)1360 |
C:\Users\Public\Pictures\Global Conference - Copy\Technical 06.jpg |
29696 |
0 |
(MsMpEng)1360 |
C:\pagefile.sys |
4096 |
0 |
(SearchIndexer)1320 |
C:\pagefile.sys |
20480 |
0 |
(SearchProtocolHost)4864 |
C:\Users\Public\Pictures\Global Conference - Copy\Technical 06.jpg |
110592 |
0 |
(SearchIndexer)4580 |
C:\pagefile.sys |
20480 |
0 |
(SearchProtocolHost)4864 |
C:\Users\Public\Pictures\Global Conference - Copy\Technical 05.jpg |
98304 |
0 |
(System)24 |
C:\Users\Public\Pictures\Global Conference - Copy\Technical 05.jpg |
131072 |
0 |
(SearchProtocolHost)4864 |
C:\Users\Public\Pictures\Global Conference - Copy\Technical 04.jpg |
98304 |
0 |
(SearchProtocolHost)4864 |
C:\Users\Public\Pictures\Global Conference - Copy\Technical 03.jpg |
98304 |
0 |
What’s happening is that PhotoAlbumWorkflow isn’t doing the disk I/O it is expected to, but it is doing the file I/O it is expected to do. The file I/O is being managed by Windows File Caching so most of the disk I/O is actually being performed by the operating system on behalf of the process. So for the first file access PhotoAlbumWorkflow is actually going to disk to get the bytes it needs (and since BitmapCacheOption.OnDemand was specified it’s not going to load the entire file into memory), but then when it writes the new metadata to the file, the I/O goes to the file cache, which will write to the disk when it flushes it cache. Once the file write occurs the different processes listening for file I/O (content indexers and anti-virus’s) scan the file. But those processes don’t scan just the metadata, so part of the file I/O they request comes from the file cache and some of it comes from the disk.
As for why the trace doesn’t show disk reads for PhotoAlbumWorkflow after Technical 01.jpg, is that the file cache tries to predict which files an application will request next, and pre-load them into memory. The prediction algorithm must have predicted that PhotoAlbumWorkflow was going to want to first four kilobytes of each file in the directory and loaded that into the cache by the time PhotoAlbumWorkflow requested it. This can be seen by viewing the trace in xperfview.exe.
To do so, I find the corresponding .etl files which were generated by the Concurrency Visualizer and merge them.
xperf -merge PhotoAlbumWorkflow_2011-08-15_162857.kernel.etl PhotoAlbumWorkflow_2011-08-15_162857.user.etl PhotoAlbumWorkflow_2011-08-15_162857.merged.etl
I then take the merged file and open it in xperfview.exe. Opening the summary table for the Disk Utilization by Process, and grouping the table by just Path Name, I am able to get this information:
Path Name |
Process |
Read Size |
Write Size |
C:\Users\Public\Pictures\Global Conference - Copy\Technical 01.jpg |
296960 |
16384 |
|
MsMpEng.exe (964) |
32768 |
0 |
|
MsMpEng.exe (964) |
5120 |
0 |
|
PhotoAlbumWorkflow.exe (7420) |
4096 |
0 |
|
MsMpEng.exe (964) |
29696 |
0 |
|
System (4) |
126976 |
0 |
|
SearchProtocolHost.exe (1152) |
98304 |
0 |
|
System (4) |
0 |
16384 |
|
C:\Users\Public\Pictures\Global Conference - Copy\Technical 04.jpg |
390656 |
12288 |
|
SearchProtocolHost.exe (1152) |
98304 |
0 |
|
SearchProtocolHost.exe (1152) |
98304 |
0 |
|
MsMpEng.exe (964) |
32768 |
0 |
|
MsMpEng.exe (964) |
30208 |
0 |
|
System (4) |
131072 |
0 |
|
System (4) |
0 |
8192 |
|
System (4) |
0 |
4096 |
While the chart doesn’t show the order in which different disk I/O’s occurred it should be apparent as to what happened. For Technical 01.jpg PhotoAlbumWorkflow read four kilobytes from the disk, later the System process wrote to the disk when it was flushing its cache. By the time PhotoAlbumWorkflow made it to reading the metadata for Technical 04.jpg System had already read the bytes from disk, so PhotoAlbumWorkflow was able to retrieve them from the file cache.
The disk I/O swim lanes in Visual Studio 11 Developer Preview do a better job of showing the relevant information on how a specific process interacts with the disk than Visual Studio 2010. One thing to remember when tracing a process that uses the file system cache is that not all file I/O is disk I/O.