Using the Concurrency Visualizer to Pick the Best Way to Parallelize a Data Set
In the application I am working on, there is a small array of objects (10 - 100 items) and a large array of objects (10,000 - 100,000). I want to know how close each object in the small array is to each object in the large array. Since calculating the value for each candidate item from the small array doesn’t involve any dependencies between the candidate items, this makes for a naturally parallel computation.
float[] results = new float[numberOfCandidates];
Parallel.For(0, numberOfCandidates, parallelOptions, c =>
{
float votersMatched = 0;
var candidateResult = candidateResults[c];
for (int voter = 0; voter < votes.Length; voter++)
{
votersMatched += percentMatch(candidateResult, votes[voter]);
}
votersMatched = votersMatched / voters;
results[c] = votersMatched;
});
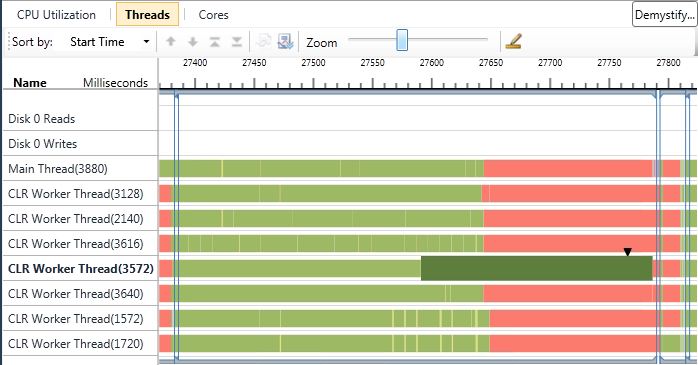
When profiled with the Concurrency Visualizer on an eight core machine, there are some CPU Utilization “valleys” which occur during the Parallel.For loop. What I imagine is happening is that numberOfCandidates isn’t naturally divisible by eight. So the Partitioner is forced to assign more work to one task than another. This becomes quite apparent when only one thread is doing work, and the other seven worker threads are doing nothing because they’re waiting for the one executing task to finish.
So what can I do to make this part of the application faster? Instead of breaking the work up based on the small array, I could break up the work based on the large array. This isn’t as natural but is still achievable by using the Parallel.For override which takes a localInit delegate a body delegate and a localFinally delegate as parameters.
float[] results = new float[numberOfCandidates];
Parallel.For<float[]>(0, voters, parallelOptions,
() => new float[numberOfCandidates],
(v, loop, subresult) =>
{
var voterResult = votes[v];
for (int can = 0; can < candidateResults.Length; can++)
{
subresult[can] += percentMatch(voterResult, candidateResults[can]);
}
return subresult;
},
subresult =>
{
lock (results)
{
for (int c = 0; c < results.Length; c++)
{
results[c] += (subresult[c] / voters);
}
}
});
To explain why this Parallel.For method is more complicated let’s step through each of the anonymous delegates. The initializing delegate creates the results array which will be used in just one task, and will be called for each task. The body delegate takes this single task result array, modifies and then returns it (so that way it can be passed to the next call to body in the same task). The final delegate gets called when the task has finished, and like init it gets called once per task. It takes the single task result array and updates the final results with what it has found. Doing so does require some coordination between the different tasks, but only once and only at the end. It is possible to parallelize over the large array, and use the simpler Parallel.For which doesn’t have an init and finally delegate, but to do so correctly would result in a lot of lock conflicts and a lot of false cache sharing during the execution of the body delegate.
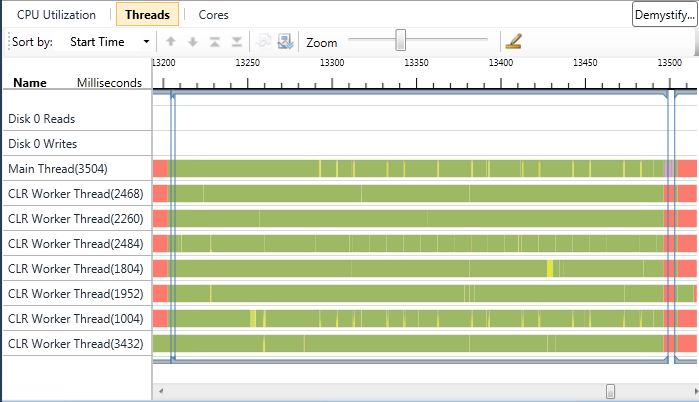
When profiling with the Concurrency Visualizer I can see that each task completes at roughly the same time with these changes.
What about wall clock time? With the initial code the application completed in roughly 16 seconds. With the more complex, but more evenly distributed work load, the application completes in roughly 12 seconds. Re-architecting my application for finer-grained parallelism allowed for a much more even load distribution among the eight cores of the computer. This resulted in a faster application. Granularity is one of the factors to keep in mind when designing parallel applications.