Becoming a Performance Explorer
In previous blog entries, we illustrated how to use the Performance Wizard to quickly start a performance session to profile runs of your application. In this post we will illustrate how to use the Performance Explorer to accomplish the same task. Using the Performance Explorer to configure collection enables more profiling scenarios than the wizard, although we will only enable concurrency profiling.
Don’t forget to start Visual Studio with administrative privileges to avoid an annoying dialog and restarting when we attempt to profile. We will not be using the Performance Wizard but let’s take a look at what the wizard is actually doing. When you launch the Performance Wizard it opens the Performance Explorer and creates a Performance Session. Performance Sessions can contain two types of information: binaries and .vsp files. The .vsp files contain the trace information from a single profiled run. Performance Sessions can be saved and re-opened later. One function of the Performance Explorer is to manage multiple Profile Sessions. This is helpful if you want to keep a history of the performance measurements between making changes. You can use a Performance Session per change where each session may contain multiple runs.
Since we are not going to use the Performance Wizard, let’s create a new Performance Session manually. From the main menu, choose "Analyze->Profiler->New Performance Session":

You may want to make the window wider to make it easier to see all the buttons on the tool bar of the Performance Explorer:

If for some reason you accidentally close the Performance Explorer or it is not visible, you can at any time, go to the main menu and choose "Analyze->Windows->Performance Explorer":

Alternatively you can also choose "View->Other Windows->Performance Explorer":

Onward to configuration, perhaps one of the more daunting tasks given the large number of options. Right click on the name of the Performance Session, Performance1, and to go Properties:

You will be presented with a dialog that looks like the following:.

In order to setup the profiling run to collect and visualize using the Concurrency Visualizer, click the "Concurrency" radio button shown in the picture below: To learn more about the other data collection methods, read
this blog entry (https://blogs.msdn.com/profiler/archive/2009/12/22/which-profiling-mode-should-i-use.aspx).

For this blog entry, there is nothing else to configure on this dialog but I encourage you to check out some of the other options listed under the various property pages listed on the left. To learn more about the other data collection methods, read
the msdn entry https://msdn.microsoft.com/en-us/library/dd537624.aspx. Press the "OK" button to save the changes and dismiss the dialog. So now that we have created a Performance Session and configured it to collect the information we are interested in, we just need to set the binary we want to profile.
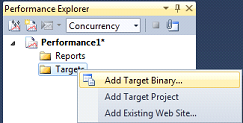
Right click on the folder labeled "Targets" and choose "Add Target Binary" or "Add Target Project", whichever is more relevant to your profiling session:

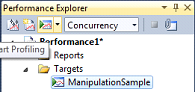
Once you have selected a binary or project you will notice the button to the left of the drop down menu has become enabled. Click this to begin profiling:

When you are done profiling you can simply close the application being profiled and view the results (after analysis completes). Congratulations, you are now an honorary "Performance Explorer".
Drake Campbell – Parallel Computing Platform