Setting Your Symbol Path in Visual Studio 2010
What are symbols?
Today we will be discussing how to configure your symbol path inside Visual Studio 2010. One might ask, “Why do I need to do this?” To answer that let us define what symbols are. Here are some excerpts from https://msdn.microsoft.com/en-us/library/cc266463.aspx
When applications, libraries, drivers, or operating systems are linked, the linker that creates the .exe and .dll files also creates a number of additional files known as symbol files.
Typically, symbol files might contain:
· Global variables
· Local variables
· Function names and the addresses of their entry points
· Frame pointer omission (FPO) records
· Source-line numbers
Each of these items is called, individually, a symbol. For example, a single symbol file Myprogram.pdb might contain several hundred symbols, including global variables and function names and hundreds of local variables.
The symbol path is the location where these symbols are being kept. Profilers use the starting addresses of functions and source-line numbers found in symbol files to generate meaningful callstacks. If you have ever used the Concurrency Visualizer and seen a callstack similar to ntkrnlpa.exe!0x81ce657c, this means we could not find the symbols for the module. As a result, we are unable to tell you the name of the function being executed or the line number.
Setting the symbol path
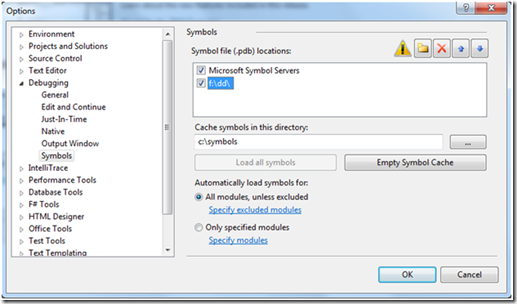
To solve the problem above, we have to set the symbol path within Visual Studio. To do this, go to the Tools menu and select Options…. You will see a dialog that looks like the one below:
On the left, go to Debugging, then Symbols. Put a check in the box that says “Microsoft Symbol Servers;” I will explain this shortly. You will see a dialog warning that using the symbol server may impact the performance; we will also address this shortly. If you have a separate location either on disk or on a network share that contains additional symbols, (for me this was f:\dd) press the button with the folder icon and enter the path. You don’t have to worry about symbols for any projects that you have opened. Visual Studio uses the current directory as one of the lookup paths. You will also notice a text box labeled “Cache symbols in this directory.” Add a local path to the text box. Lastly, press ok.
So what are the Microsoft Symbol Servers? At a high level, they are a public place where we keep the symbols for products that we have released. For a more detailed explanation on symbol servers, see https://msdn.microsoft.com/en-us/library/cc266479.aspx. Since this is a network service, communicating with the server to resolve symbols may take some time depending on your internet connection. That is what the “Cache symbols in this directory” step is for. First, Visual Studio will check if the symbol it wants is in the cache. If it does not find it in the cache, it will start to use the paths from the dialog, including the symbol server if it was checked. As it finds them, Visual Studio will copy symbols into the cache, making them available for faster lookup next time.
How do I know it worked?
If you already have a .vsp available, try opening it. If you do not, you can start a new profiling session and collect one. For help getting started you can follow the steps in a previous post at https://blogs.msdn.com/visualizeparallel/archive/2009/10/27/beginner-s-guide-to-profiling-parallel-apps-part-i.aspx. While the .vsp is being processed, open the Output Window. You can do this by going to View menu and selecting the Output menu item. If you read the spam you can see messages like “Loaded symbols for…” and “Failed to load symbols for….” The failure to resolve symbols is only really a problem if they are yours. You may not care to resolve symbols from your graphics drivers, for example. Alas, that will have to be another blog post. Thanks for reading and keep the feedback coming.
Drake Campbell – Parallel Developer Tools
