What is the Timeline Caret?
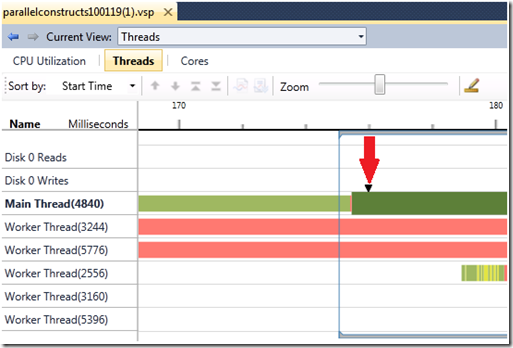
What is the Timeline Caret marker anyway? Here is a picture.
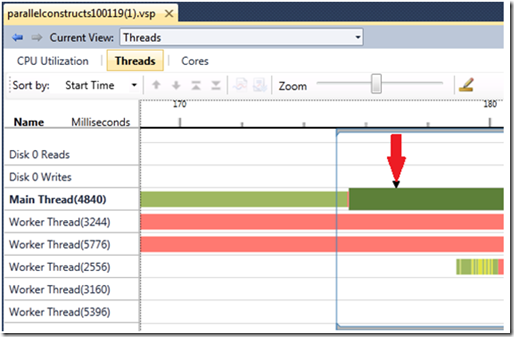
There is a ton of information in this picture so let us focus on what is relevant. I have selected (left click) an executing (green) segment. The selected region is now larger, highlighted, and contains a Timeline Caret. The Caret only appears when execution segments are selected and can appear at different locations within a single execution segment. The Timeline Caret moves relative to where you click on the execution segment. You can do this by clicking again on the execution segment, but at a different time. See the picture below.
You may notice that the Timeline Caret does not directly correspond to the exact location you clicked. Why not? What does it mean then? One of the things that the Concurrency Visualizer does is collect sample profile events during program execution. That means that, by default, every millisecond a sample callstack is taken. The Timeline Caret indicates the time/location for one of these sample profiles within a selected execution segment.
Since the sample is taken on an interval there may be some execution segments that do not contain a sample callstack. If callstack information is present it can be viewed in the Current stack tab of the reports.
-Drake Campbell, Parallel Computing Platform

