Green Isn’t Always Good
One reason to use the Concurrency Visualizer is to maximally utilize system resources. To aid in this effort, it displays the execution of the program as green segments in its timeline. However, the Visualizer does not distinguish between the user’s work and any other work in the process, so seeing a lot of green doesn’t necessarily mean that the program is working efficiently. For example, I can write a simple program that generates thousands of unnecessary objects, forcing the garbage collector to execute when I would expect my code to be running. The Concurrency Visualizer would display this overhead as green segments which I could mistake for my code’s execution. Consider a simple example where I (very inefficiently) create a list of the even numbers between 0 and n:
int n = 1000000000; ArrayList l = new ArrayList();
for(int i = 0; i < n; i++)
{
Object o = new { val = i }; // Allocate an object that wraps an int
if (i % 2 == 0)
l.Add(o); // Some longer living objects, objects not in l get collected
}
Let’s walk through the Concurrency Visualizer profile of this application.
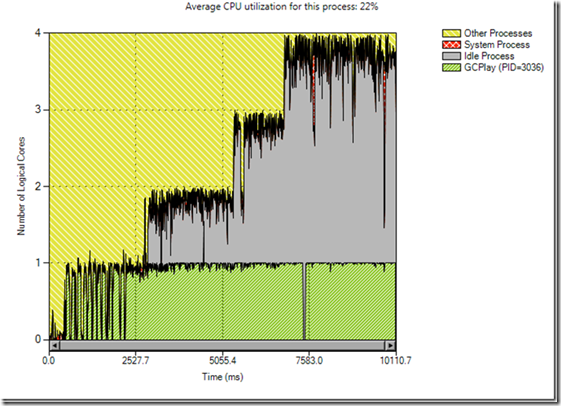
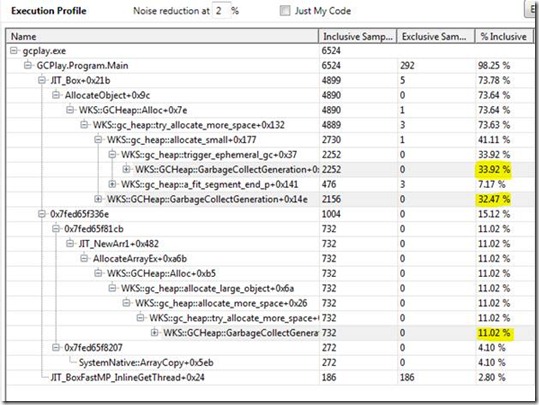
For a single-threaded program, it appears to be quite efficient. It’s almost always running on one core, which means that it’s not blocking on synchronization objects, IO, etc. This is good! Perhaps we’d even consider writing a concurrent version to exploit the extra available resources on the machine. However, if we look at the Execution Report, we see that we’re really not executing my code:
Notice how much time is spent in garbage collections—about 77%! This is clearly not what we want our application to be doing, and had we not looked at the Execution Profile, we might have mistaken the execution on the timeline to be the execution of our code.
While the green shown in the CPU and Threads views is a quick way to gain insight, it is recommended that one also examines the Execution Profile to get the full picture.
Matt Jacobs - Parallel Computing Platform


