IS Consulting Releases MapDotNet UX Beta
 IS Consulting just released the Beta of their MapDotNet UX product and the folks in the GIS world had better take notice. It's funny over the years how everyone thinks they've got the next "Arc-XXX killer," yet ESRI continues to persevere - they're doing a lot of things right; however, the MapDotNet UX product certainly should be raising some eyebrows down in Redlands.
How's this for a foundation to power a suite of geospatial applications:
- Windows Communications Foundation (WCF)-based web services
- Windows Presentation Foundation (WPF) Map and Tile renderer
- Virtual Earth Base Map Data and Imagery
- Silverlight 2.0 Map Control
- Extensible Class Library with documented SDK
- Map Design Capabilities
- Spatial Data Import (Shapefile, SQL Server 2008, ArcSDE and PostGIS)
Welcome to the gun show (MapDotNet flexing biceps).
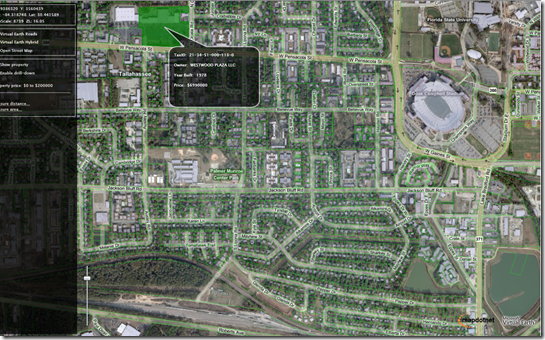
IS Consulting has provided two demonstration applications to illustrate the power of their UX. The first is a drill down demonstration using the Silverlight 2.0 interface to render the Virtual Earth tiles and land parcels in Florida. Once you check the box for "Enable Drill Down" any parcel you hover over will highlight and call out a popup to display additional information about the land parcel - TaxID, Owner, Year Built and Price.
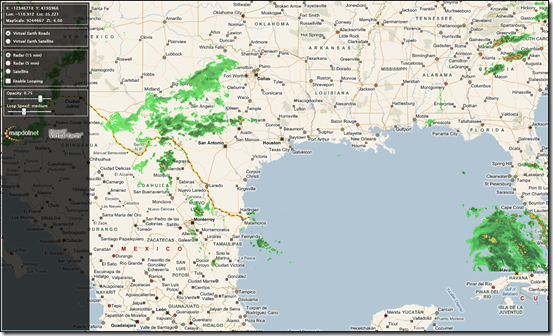
The second demonstration application also uses a Silverlight 2.0 interface and Virtual Earth tiles, but renders real time weather feeds as raster information to show weather conditions over either our aerial or road tiles. You can also control the radar refresh rate (5 or 15 minutes) and you can enable LOOPING! Because the interface uses Silverlight, they're able to animate the weather loop as it moves along it's path. Wow! That alone is worth checking out the application and the suite that goes with it.
 And, how about these types of native functions in their SDK:
- Drill-down Identify
- Custom Legend
- Spatial Query By Rectangle
- Integrate a MapTOC
- Perform a Hot-spot Analysis
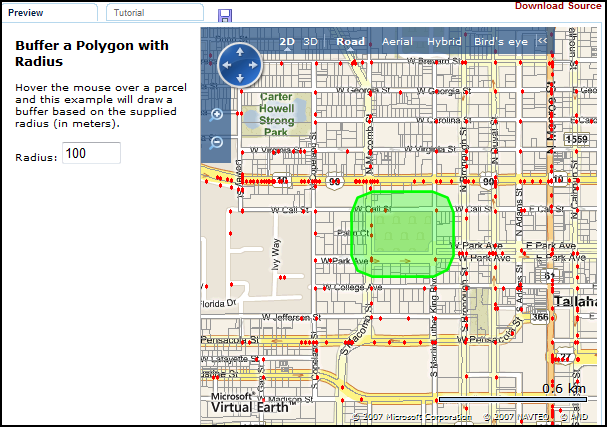
- Buffer a Polygon with Radius
- Capture an Envelope Change
- Multiple Tile Layers
- Tile Layer Highlighting
- Save and Reload Map State
- Draw, Edit, and Delete Shapes
- Overlay Multiple Maps
- Display a WMS
- Build a Page from Scratch
Plus, the interactive SDK (very much like the Virtual Earth interactive SDK) allows you to interact with the application, see a tutorial on what the method does, save any changes to the method you've made for interaction and download the source code.
This is an extremely powerful suite of geospatial data visualization services. Worth a looksee if you're exploring how to get data out of some of your archaic geo-data stores and onto the web in some of the newer interfaces.
CP