Measuring Households Affected By Flooding Rivers
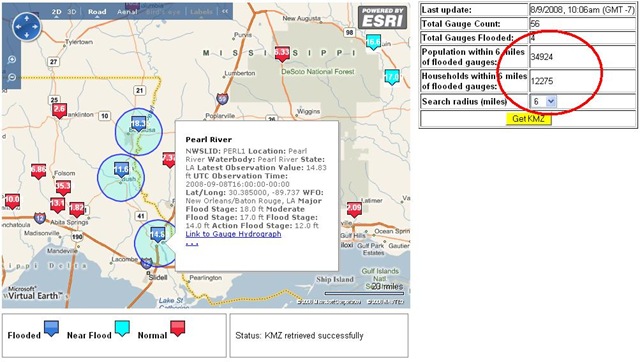
Water, water everywhere nor any drop to drink - Rime of the Ancient Mariner, by Samuel Taylor Coleridge. And, with all the water everywhere caused by hurricanes, melting ice, and thunderous storms leading to overflowing riverbeds, it's only right to visualize such information using a Microsoft Virtual Earth application. The ESRI team came up with a great mashup using a NOAA KMZ (to pinpoint which rivers are flooding), a Virtual Earth map (as the backdrop) and the ArcGIS Server JavaScript API (for computation). For this application, the ArcGIS Server JavaScript API allows you to (1) take the flooded river point data from the KMZ, (2) perform a configurable radius search around each point in the KMZ, (3) find the population and number of households residing within each radius searching against demographic information and (4) present the results atop Virtual Earth.
GIS is getting so simple! What will we tell management is taking so long to develop applications? The code sample is available for this in the ESRI ArcGIS Server JavaScript Code Gallery.
CP