Virtual Earth-based Loss Estimation Tool
Earthquake damage assessment just got a little easier. In the spirit of the close of the ESRI User Conference, I figured it was appropriate to post a little something about a GIS application using Microsoft Virtual Earth - enter Inlet (Internet-based Loss Estimation Tool) - okay, my post name is unoriginal. Inlet is a web-based loss estimation and transportation modeling platform used to evaluate whether Information Technology (IT) solutions can reduce the impacts of disasters on transportation systems.
According to the site , "INLET currently incorporates GIS, a risk model, and a transportation model to provide online estimates for building damage, transportation impacts, and casualties. Additional features include a demonstration of a model simulating the effect of IT on evacuation routing. Specifically, the model illustrates how awareness of a disaster scenario and familiarity with routing alternatives can impact traffic congestion and evacuation time."
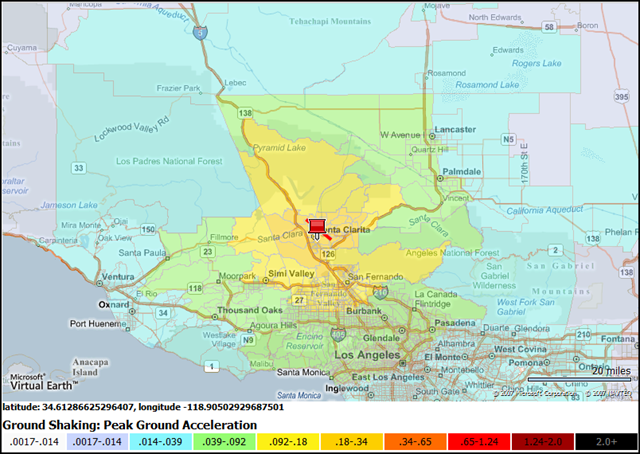
First, I selected the spot to run the simulation. I used Santa Clarita, CA where I went to High School - not my favorite place in the world, so let's blow it up. Next I set the magnitude of the quake and the depth of the quake. The epicenter latitude and longitude are read from where I clicked on the map (or I could manually input this here). Finally, I click "Run Simulation." The application then hits the GIS data source to estimate the cost of properties in the damage zone. The visualization is presented on Virtual Earth maps illustrating the different levels of damage by color coding the areas.
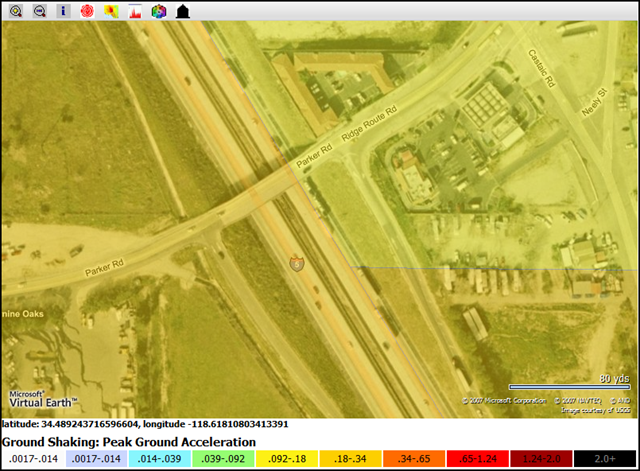
Additionally, tabular information is provided for the number of damaged buildings, percentage of damaged buildings, injuries and casualties and bridge damage if available. In this scenario, a magnitude 6 earthquake at 8 kilometers below the surface, centered on Santa Clarita would have have at least slight damage to over 200,000 buildings. I'd love to see some aerial photography integration and clickable parcels to really get down to a granular level of which property has approximately how much damage.
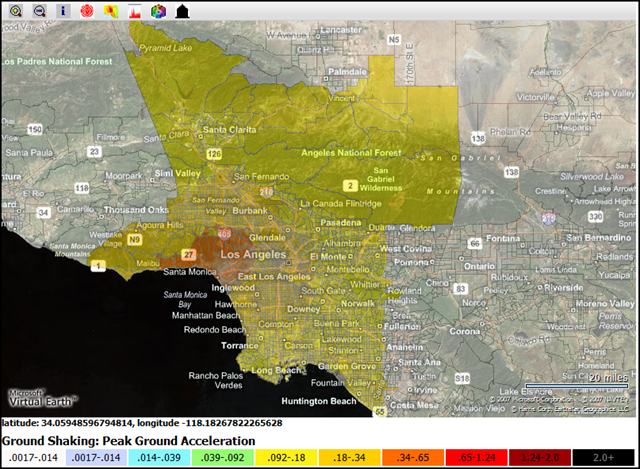
And, that's just the custom earthquake scenario! The application also includes USGS Earthquake Simulations (ShakeMap), Census Track Results, Thematic Mapping, and plotting of facilities.
The site currently only works for California. I was in the Northridge Earthquake and yes there are strange lights in the sky during an earthquake. Perhaps the lights are the lights of the UFOs taking off- the real cause of the quake. Or, perhaps I watch too much X-Files.
CP