SOS your Visual Studio
If you as a developer are interested in taking quick peeks into memory allocation you can load SOS (Son Of Strike) in Visual Studio to do that. SOS is written as a WinDbg extension but can load in Visual Studio and do most of the stuff.
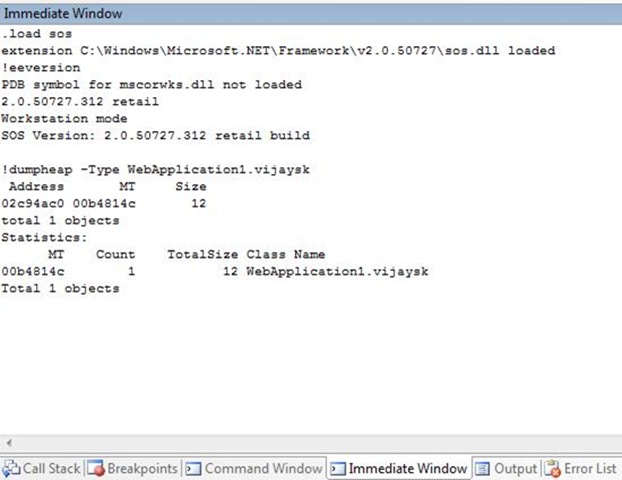
To begin with you will have to go to the Properties of the project and check "Enable unmanaged code debugging" under the Debug options. Once you hit a breakpoint you can load SOS in the Immediate Window (Ctrl+Alt+I). It is similar to working with WinDbg you use the .load command to load the extension.
.load sos

Once loaded you can start running standard SOS commands (Use !heap for all SOS commands).
If you want to switch the thread context you will have to use the Threads Window(Ctrl+Alt+H) All you need to do is double click on the Thread in the Thread Window. You can use the thread ID to match the !threads output to the Threads Window.
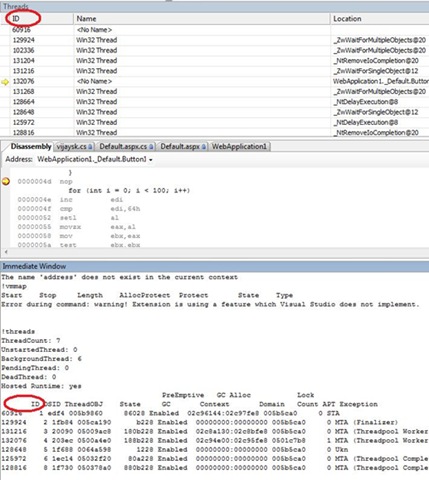
A couple of commands like !vmmap will error out in Visual Studio
"Extension is using a feature which Visual Studio does not implement."
Also note that by default with ASP.NET projects you are debugging the Cassini process. You can also attach to a IIS worker process running your code and break into it.