
Step Back – Going Back in C++ Time
Step Back for C++
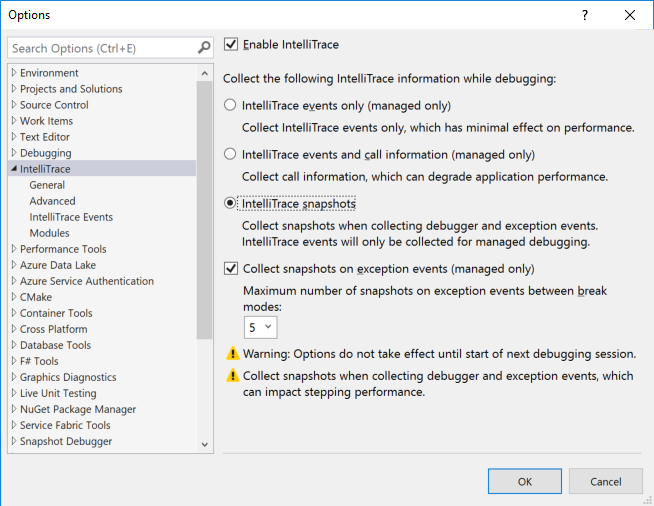
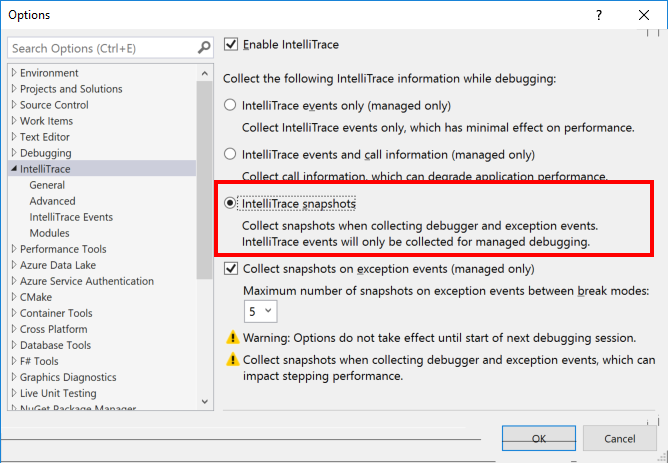
In the most recent, 15.9, update to Visual Studio 2017 Enterprise Edition, we’ve added “Step Back” for C++ developers targeting Windows 10 Anniversary Update (1607) and later. With this feature, you can now return to a previous state while debugging without having to restart the entire process. It’s installed as part of the C++ workload but set to “off” by default. To enable it, go to Tools -> Options -> IntelliTrace and select the “IntelliTrace snapshots” option. This will enable snapshots for both Managed and Native code.
Once “Step Back” is enabled, you will see snapshots appear in the Events tab of the Diagnostic Tools Window when you are stepping through C++ code.
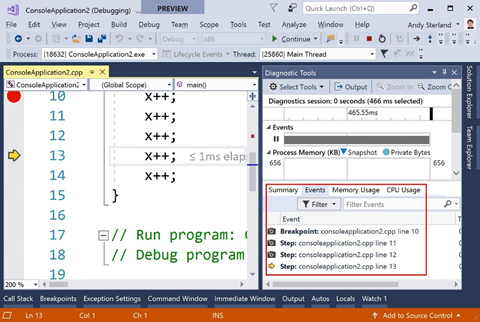 Clicking on any event will take you back to its respective snapshot – which is a much more productive way to go back in time if you want to go further back than a few steps. Or, you can simply use the Step Backward button on the debug command bar to go back in time. You can see “Step Back” in action in concurrence with “Step Over” in the gif below.
Under the Hood
So far, we’ve talked about “Step Back” and how you can enable and use it in Visual Studio, but you could have read that on the VS blog. Here on the VC++ blog, I thought it would be interesting to explain how the feature works and what the trade offs are. After all, no software, debuggers included, are magical!
At the core of “Step Back” is an API in Windows called PssCaptureSnapshot (docs). While the API isn’t very descriptive, there are two key things that it does to a process. Given a target process it will:
- Create a ‘snapshot’ which looks suspiciously like the child process of an existing process that has no threads running.
- Mark the processes memory, it’s page tables (Wikipedia), as copy-on-write (Wikipedia). That means that whenever a table is written to, the table is copied.
The important thing about the above is that between the two you basically get a copy of the entire virtual memory space used by the process that you snapshotted. From inside that process you can then inspect the state, the memory, of the application as it was at the time the snapshot was created. This is handy for the feature which the API was originally designed for; the serialization of a process at the point of failure .
In VS when debugging C++, we take these snapshots on certain debugger events, namely:
- When a breakpoint is hit
- When a step event occurs – but only if the time between the stepping action and the previous stepping action is above a certain threshold (around ~300ms). This helps with the case where you are hammering the stepping buttons and just want to step at all possible speed.
From a practical perspective, that means there will be a snapshot as you step through code. We keep a First in First Out buffer of snapshots, freeing them up as more are taken. One of the downsides of this approach, is that we aren’t taking snapshots as your app is running so you can’t hit a breakpoint and then go back to see what happened before the breakpoint was hit.
Now there is a copy of the process, a snapshot, but how does that get debugged in VS?
Well, this is the ‘easy’ bit, basically when you hit “Step Back” or activate a snapshot from the Diagnostic Tools window, VS goes ahead and attaches the debugger to that process. We hide this from you in the VS UI, so it still looks like you are debugging the process you started with, but in reality, you are debugging the snapshot process with all the state from the past. Once you go back to ‘live’ debugging you will back to the main process which is still paused at the location you left it.
Performance of Step Back
One of the first considerations of adding any new feature to the debugger is on how it might impact the performance of VS while debugging. While improving performance of VS is something of a Sisyphean task and as many improvements as we make there is more to be made as well as additional features that take some of those wins. Taking a snapshot takes time, everything does, in this case it takes time both in the process being debugged and back in VS. There’s no sure way to predict how long it will take as it’s dependent on the app and how it’s using memory, but while we don’t have a magic 8 ball, we do have data, lots of it…
As of the time of writing, from testing and dogfooding usage in the last 28 days use we’ve seen 29,635,121 snapshots taken across 14,738 machines. From that data set we can see that the 75th percentile for how long it took to take a snapshot is 81ms. You can see a more detailed breakdown in the graph below.
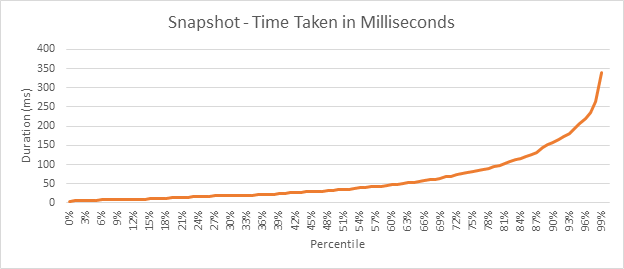 In any case, if you were wondering why “Step Back” isn’t on by default, that graph above is why, “Step Back” simply impacts stepping performance too much to be on by default, all the time, for everyone. Instead, it’s a tool that you should decide to use and, by and large, you’ll likely never notice the impact. Though, if you did we will turn off “Step Back” and show a ‘gold bar’ notification that we’ve done so. The ‘gold bars’ are the notifications that pop at the top of the editor, the picture below shows the one for when you try “Step Back” without snapshots being enabled.
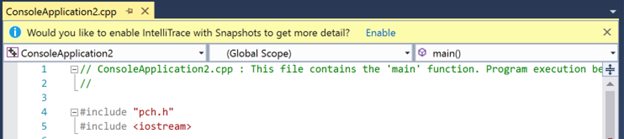 That’s the CPU usage aspect of performance out the way, now to look at the second aspect, memory.
As you continue to debug your app and the app continues execution it will no doubt write to memory. This could be to set a value from 1 to 2 as in the example above. Or it could be something more complex, but in any case, when it comes time to write that change the OS is going to copy the associated page table to a new location. Duplicating the data that was changed, and potential other data, at the new location, while keeping the old. That new location will continue to be used. That means that the old location still has the old value, 1, from the time the snapshot was taken, and the new location has the value of 2. As Windows is now copying memory as it’s written, the app will consume more memory. How much though depends on the application and what it’s doing. The consumption of memory is directly proportional to how volatile it is. For example, in the trivial app above each step is going to consume a tiny bit more data. But, if the app instead were encoding an image or doing something intense a lot more memory would get consumed than would be typical.
Now as memory, even virtual, is finite this poses some limitations on step back. Namely that we can’t keep an infinite number of snapshots around. At some point we have to free them and their associated memory up. We do that in two ways; firstly, the snapshots are let go on a First in First out basis once a limit of a 100 has been reached. That is, you can never step back more than a 100x. That cap is arbitrary though, a magic number. There’s an additional cap that’s enforced and based on heuristics, essentially VS is watching memory usage and in the event of low memory snapshots get dropped starting with the oldest – just as if a 100 was hit.
Conclusion
We’ve covered how you can use “Step Back” and how it works under the hood and hopefully you are now in a place to make an informed decision on when to use the feature. While this feature is only in the Enterprise versions of Visual Studio you can always try out the preview channel of Visual Studio Enterprise. I highly recommend you go turn it on, for me, personally it’s saved a whole bunch of time not restarting a debug session. And when you do use the feature I’d love to hear your feedback, and as ever if you have any feedback on the debugger experience in VS let us know!
- Developer Community: https://developercommunity.visualstudio.com/
- https://docs.microsoft.com/en-us/visualstudio/ide/talk-to-us?view=vs-2017
You can also reach me by mail at andster@microsoft.com)or on twitter at https://twitter.com/andysterland.
Thanks for reading!
Andy Sterland
Program Manager, Visual Studio, Diagnostics Team
 Light
Light Dark
Dark
0 comments