
Debugging an embedded ARM device in Visual Studio
We introduced support for ARM GCC cross compilation in Visual Studio 2017 in the 15.5 release. With 15.6 Preview 2, we are adding support for debugging. This overview of debugging capabilities follows from the setup for getting started ARM cross compilation and will be integrated there as an addendum.
First, it is important to ensure your output has debugging symbols. In the case of the GCC projects exported from the ARM online compiler, they do not. To add them, edit the makefile under the tools and flags section and add the -g flag for the GCC and G++ commands like the below.
CC      = 'arm-none-eabi-gcc' '-g' ...
CPP     = 'arm-none-eabi-g++' '-g' ...
Now after you have built your binary and flashed the device, right click on the binary output and select Debug and Launch Settings.

In the dialog that pops up select C/C++ Debug microcontroller (gdbserver).

This will create a launch.vs.json that has many options expressed that are relevant for embedded debugging. There are many ways to debug these kinds of devices so what you fill in here will be specific to your board, the hardware debugger and its associated software that provides a gdbserver interface. We are providing as many defaults and hints as we can to help you. In this preview some of the environment variables emitted are not working yet, you will need to substitute these with the values needed.
- ${workspaceRootFolderName}, your folder name
- ${env.gccpath}, your VS installation path followed by Linux\gcc_arm\bin
- ${debugInfo.linuxNatvisPath}, path to a Natvis file if you have one. This is fine to remove as it is for specific scenarios.
I will walk through configuring this with the ST Nucleo-F411RE using OpenOCD. The process is similar for most boards.
First, change the program name in the output to point to your .elf file.
"program": "${workspaceRoot}\\BUILD\\Nucleo_blink_led.elf",
Change the miDebuggerPath to point to the full path to arm-none-eabi-gdb.exe.
"miDebuggerPath": "C:\\Program Files (x86)\\Microsoft Visual Studio\\Internal\\Enterprise\\Linux\\gcc_arm\\bin\\arm-none-eabi-gdb.exe",
In the “setupCommands”, you can remove the documentation link section (leaving it is not harmful). Change the symbol load to point to your .elf file.
"text": "-file-exec-and-symbols Nucleo_blink_led.elf",
You can execute additional commands to get your board into a proper state for debugging, often you need to halt and then reset the board at the beginning of a session. To do so add those command as part of the setup commands array as follows.
{
"text": "monitor reset halt",
"ignoreFailures": true
},
{
"text": "monitor reset init",
"ignoreFailures": true
}
Make sure the miDebuggerServerAddress matches the location your hardware debugger will provide. This is the default for OpenOCD.
"miDebuggerServerAddress": "localhost:3333",
If you want to launch your hardware interface yourself manually you can omit these lines. If you want VS to start the software to interface with your hardware debugger this is an example for launching OpenOCD with a config file. You should check this command by running it manually to make sure you have the correct config file and that the text used to validate the server has started is correct.
"debugServerPath": "D:\\openocd-0.10.0\\bin-x64\\openocd.exe",
"debugServerArgs": "-f d:/openocd-0.10.0/scripts/board/st_nucleo_f4.cfg",
"serverStarted": "Info : stm32f4x.cpu: hardware has 6 breakpoints, 4 watchpoints",
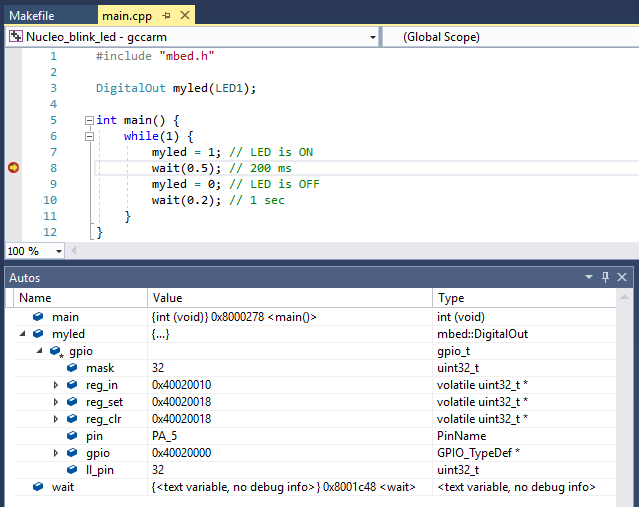
Now with our configuration done use F5 to start debugging your embedded ARM application on your device from Visual Studio.
What’s next
Download the Visual Studio 2017 Preview, install the Linux C++ Workload, select the option for Embedded and IoT Development and give it a try with your projects.
We’re actively working on additional support for embedded scenarios. Your feedback here is very important to us. We look forward to hearing from you and seeing the things you make.
The best way to reach us is via our GitHub hosted issue list, directly via mail at vcpplinux-support@microsoft.com or find me on Twitter @robotdad.
 Light
Light Dark
Dark
2 comments
How to pass command line arguments to linux debuggee in VS2019 Preview 3?
I can’t find corresponding field in launch_schema.json.
How would we setup to flash the embedded firmware as a prerequisite step? In this case I need to use the Nordic nrfjprog.exe to program and then reset the embedded target then run the GDB server, and then connect the GDB debugger where the last 2 steps are covered but not sure about the first 2.