
C++ Code Editing and Navigation in Visual Studio
Visual Studio comes packed with a set of productivity tools to make it easy for C++ developers to read, edit, and navigate through their code. In this blog post we will dive into these features and go over what they do. This post is part of a series aimed at new users to Visual Studio.
This blog post goes over the following concepts:
- Reading and Understanding Code
- Navigating Around Your Codebase
- Authoring and Refactoring Code
- Keyboard Shortcut Reference
- Conclusion
Reading and Understanding Code
If you’re like most developers, chances are you spend more time looking at code than modifying it. With that in mind, Visual Studio provides a suite of features to help you better visualize and understand your project.
Basic Editor Features
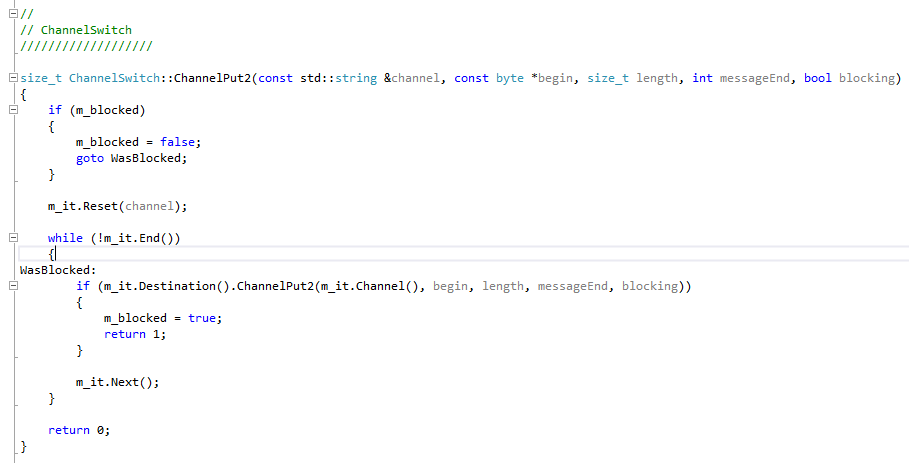
Visual Studio automatically provides syntax colorization for your C++ code to differentiate between different types of symbols. Unused code (e.g. code under an #if 0) is more faded in color. In addition, outlines are added around code blocks to make it easy to expand or collapse them.
 If there is an error in your code that will cause your build to fail, Visual Studio adds a red squiggle where the issue is occurring. If Visual Studio finds an issue with your code but the issue wouldn’t cause your build to fail, you’ll see a green squiggle instead. You can look at any compiler-generated warnings or errors in the Error List window.
 If you place your cursor over a curly brace, ‘{‘ or ‘}’, Visual Studio highlights its matching counterpart.
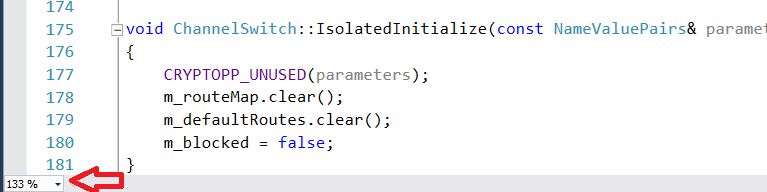
You can zoom in or out in the editor by holding down Ctrl and scrolling with your mouse wheel or selecting the zoom setting in the bottom left corner.
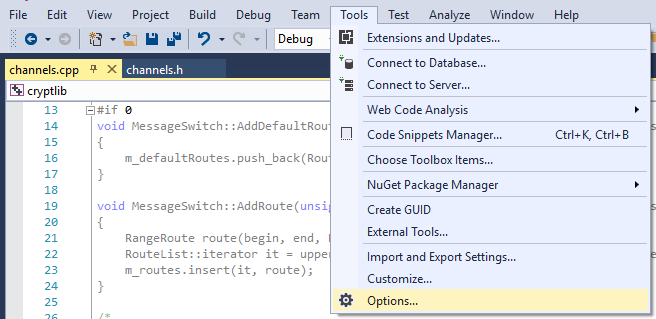
The Tools > Options menu is the central location for Visual Studio options, and gives you the ability to configure a large variety of different features. It is worth exploring to tailor the IDE to your unique needs.
 You can add line numbers to your project by going to Text Editor > All Languages > General or by searching for “line num” with Quick Launch (Ctrl + Q). Line numbers can be set for all languages or for specific languages only, including C++.
Quick Info and Parameter Info
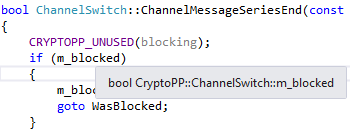
You can hover over any variable, function, or other code symbol to get information about that symbol. For symbols that can be declared, Quick Info displays the declaration.
 When you are writing out a call to a function, Parameter Info is invoked to clarify the types of parameters expected as inputs. If there is an error in your code, you can hover over it and Quick Info will display the error message. You can also find the error message in the Error List window.
 In addition, Quick Info displays any comments that you place just above the definition of the symbol that you hover over, giving you an easy way to check the documentation in your code.
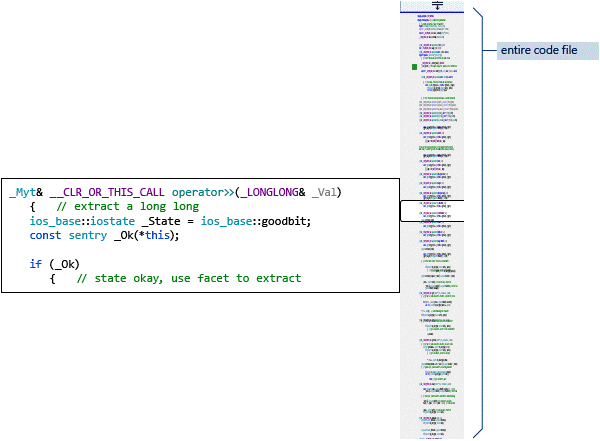
Scroll Bar Map Mode
Visual Studio takes the concept of a scroll bar much further than most applications. With Scroll Bar Map Mode, you can scroll and browse through a file at the same time without leaving your current location, or click anywhere on the bar to navigate there. Even with Map Mode off, the scroll bar highlights changes made in the code in green (for saved changes) and yellow (for unsaved changes). You can turn on Map Mode in Tools > Options > Text Editor > All Languages > Scroll Bars > Use map mode for vertical scroll bar or by searching for “map” with Quick Launch (Ctrl + Q).
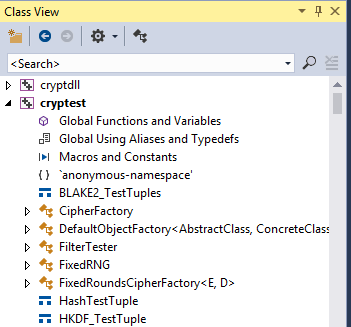
Class View
There are several ways of visualizing your code. One example is Class View. You can open Class View from the View menu or by pressing Ctrl + Shift + C. Class View displays a searchable set of trees of all code symbols and their scope and parent/child hierarchies, organized on a per-project basis. You can configure what Class View displays from Class View Settings (click the gear box icon at the top of the window).
Generate Graph of Include Files
To understand dependency chains between files, right-click while in any open document and choose Generate graph of include files.
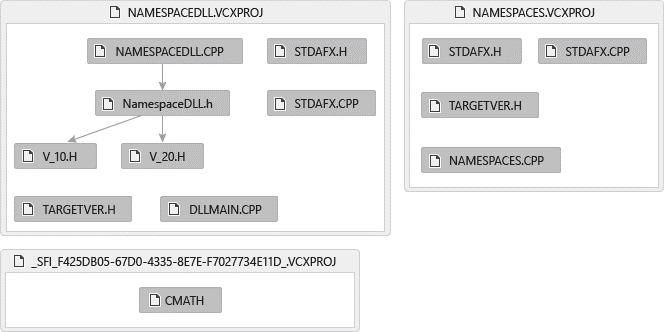 You also have the option to save the graph for later viewing.
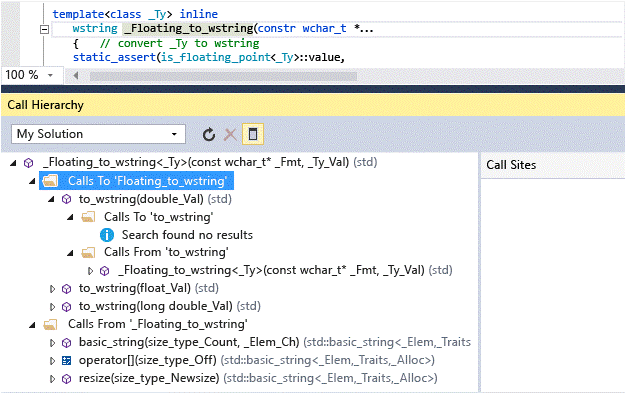
View Call Hierarchy
You can right-click any function call to view a recursive list of its call hierarchy (both functions that call it, and functions that it calls). Each function in the list can be expanded in the same way. For more information, see Call Hierarchy.
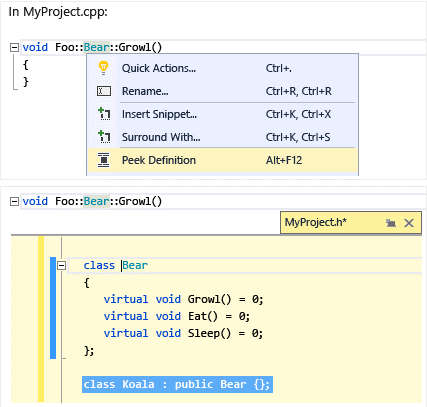
Peek Definition
You can check out the definition of a variable or function at a glance, inline, by right-clicking it and choosing Peek Definition, or pressing Alt+F12 with the cursor over that symbol. This is a quick way to learn more about the symbol without having to leave your current position in the editor.
Navigating Around Your Codebase
Visual Studio provides a suite of tools to allow you to navigate around your codebase quickly and efficiently.
Open Document
Right-click on an #include directive in your code and choose Open Document, or press Ctrl+Shift+G with the cursor over that line, to open the corresponding document.
Toggle Header/Code File
You can switch between a header file and its corresponding source file or vice versa, by right-clicking anywhere in your file and choosing Toggle Header / Code File or by pressing its corresponding keyboard shortcut: Ctrl+K, Ctrl+O.
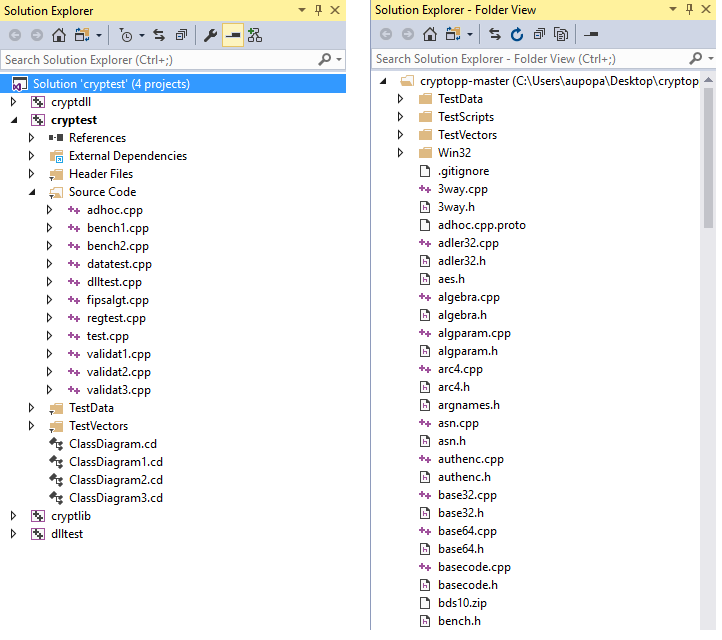
Solution Explorer
Solution Explorer is the primary means of managing and navigating between files in your solution. You can navigate to any file by clicking it in Solution Explorer. By default, files are grouped by the projects that they appear in. To change this default view, click the Solutions and Folders button at the top of the window to switch to a folder-based view.
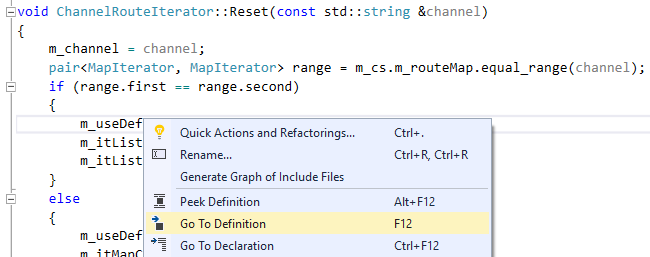
Go To Definition/Declaration
You can navigate to the definition of a code symbol by right-clicking it in the editor and choosing Go To Definition, or pressing F12. You can navigate to a declaration similarly from the right-click context menu, or by pressing Ctrl+F12.
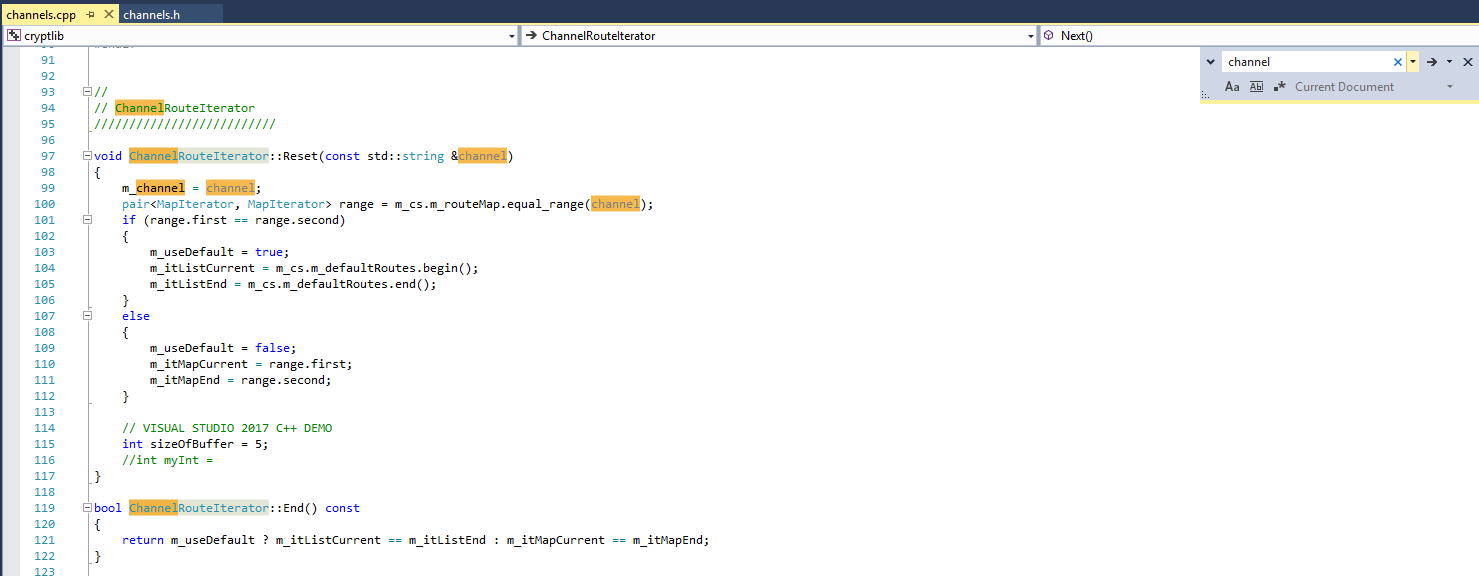
Find / Find in Files
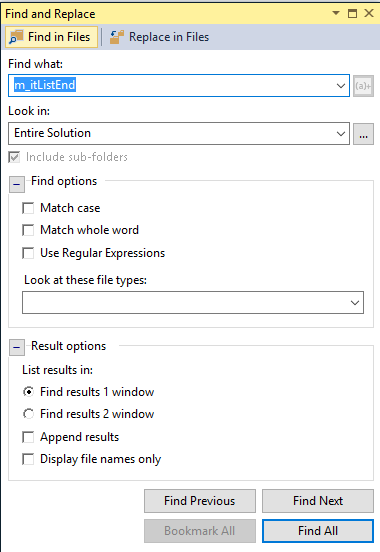
You can run a text search for anything in your solution with Find (Ctrl+F) or Find in Files (Ctrl+Shift+F).
Find can be scoped to a selection, the current document, all open documents, the current project, or the entire solution, and supports regular expressions. It also highlights all matches automatically in the IDE.
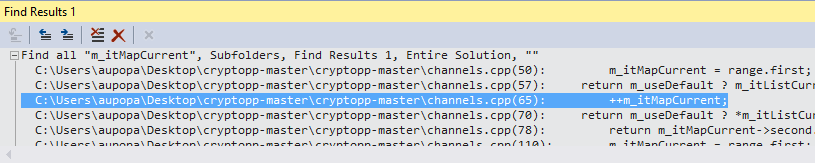
 Find in Files is a more sophisticated version of Find that displays a list of results in the Find Results window. It can be configured even further than Find, such as by allowing you to search external code dependencies, filter by filetypes, and more. You can organize Find results in two windows or append results from multiple searches together in the Find Results window. Individual entries in the Find Results window can also be deleted if they are not desired.
Find All References
Find All References displays a list of references to the chosen symbol. For more information on Find All References, check out our blog post, Find All References Re-designed for Larger Searches.
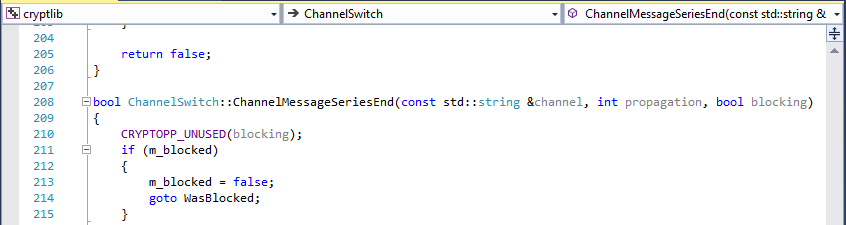
Navigation Bar
You can navigate to different symbols around your codebase by using the navbar that is above the editor window.
Go To
Go To (Ctrl + T) is a code navigation feature that can be used to navigate to files, code symbols or line numbers. For more information, take a look at Introducing Go To, the Successor to Navigate To.
Quick Launch
Quick Launch makes it easy to navigate to any window, tool, or setting in Visual Studio. Simply type Ctrl+Q or click on the search box in the top-right corner of the IDE and search for what you are looking for.

Authoring and refactoring code
Visual Studio provides a suite of tools to help you author, edit, and refactor your code.
Basic Editor Features
You can easily move lines of code up and down by selecting them, holding down Alt, and pressing the Up/Down arrow keys.
To save a file, press the Save button at the top of the IDE, or press Ctrl+S. Generally though, it’s a good idea to save all your changed files at one time by using Save All (Ctrl+Shift+S).
Change Tracking
Any time you make a change to a file, a yellow bar appears on the left to indicate that unsaved changes were made. When you save the file, the bar turns green.
![]() The green and yellow bars are preserved as long as the document is open in the editor. They represent the changes that were made since you last opened the document.
The green and yellow bars are preserved as long as the document is open in the editor. They represent the changes that were made since you last opened the document.
IntelliSense
IntelliSense is a powerful code completion tool that suggests symbols and code snippets for you as you type. C++ IntelliSense in Visual Studio runs in real time, analyzing your codebase as you update it and providing contextual recommendations based on the characters of a symbol that you’ve typed. As you type more characters, the list of recommended results narrows down.
 In addition, some symbols are omitted automatically to help you narrow down on what you need. For example, when accessing a class object’s members from outside the class, you will not be able to see private members by default, or protected members (if you are not in the context of a child class).
After you have picked out the symbol you want to add from the drop-down list, you can autocomplete it with Tab, Enter, or one of the other commit characters (by default: {}[]().,:;+-*/%&|^!=?@#\).
TIP: If you want to change the set of characters that can be used to complete IntelliSense suggestions, search for “IntelliSense” in Quick Launch (Ctrl + Q) and choose the Text Editor -> C/C++ -> Advanced option to open the IntelliSense advanced settings page. From there, edit Member List Commit Characters with the changes you want. If you find yourself accidentally committing results you didn’t want or want a new way to do so, this is your solution.
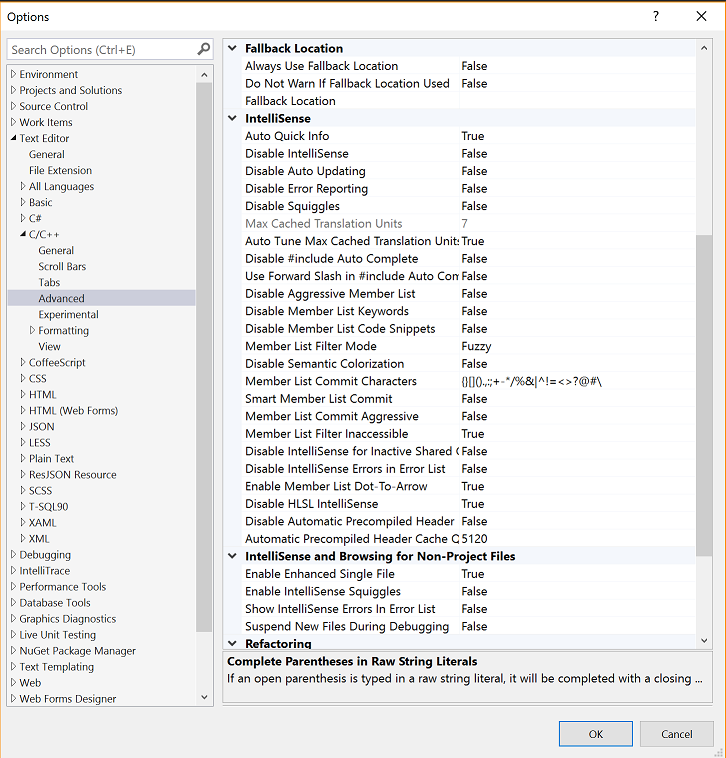 The IntelliSense section of the advanced settings page also provides many other useful customizations. The Member List Filter Mode option, for example, has a dramatic impact on the kinds of IntelliSense autocomplete suggestions you will see. By default, it is set to Fuzzy, which uses a sophisticated algorithm to find patterns in the characters that you typed and match them to potential code symbols. For example, if you have a symbol called MyAwesomeClass, you can type “MAC” and find the class in your autocomplete suggestions, despite omitting many of the characters in the middle. The fuzzy algorithm sets a minimum threshold that code symbols must meet to show up in the list.
If you don’t like the fuzzy filtering mode, you can change it to Prefix, Smart, or None. While None won’t reduce the list at all, Smart filtering displays all symbols containing substrings that match what you typed. Prefix filtering on the other hand purely searches for strings that begin with what you typed. These settings give you many options to define your IntelliSense experience, and it’s worth trying them out to see what you prefer.
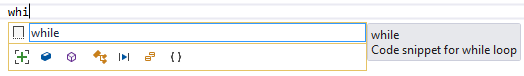
IntelliSense doesn’t just suggest individual symbols. Some IntelliSense suggestions come in the form of code snippets, which provide a basic example of a code construct. Snippets are easily identified by the square box icon beside them. In the following screenshot, “while” is a code snippet that automatically creates a basic while loop when it is committed. You can choose to toggle the appearance of snippets in the advanced settings page.
 Visual Studio 2017 provides two new IntelliSense features to help you narrow down the total number of autocomplete recommendations: Predictive IntelliSense, and IntelliSense filters. Check out our blog post, C++ IntelliSense Improvements – Predictive IntelliSense & Filtering, to learn more about how these two features can improve your productivity.
If you ever find yourself in a situation where the list of results suggested by IntelliSense doesn’t match what you’re looking for, and you already typed some valid characters beforehand, you can choose to unfilter the list by clicking the Show more results button in the bottom left corner of the drop-down list–which looks like a plus (+)—or by pressing Ctrl + J. This will refresh the suggestions, and add some new entries. If you’re using Predictive IntelliSense, which is an optional mode that uses a stricter filtering mechanism than usual, you may find the list expansion feature even more useful.
Quick Fixes
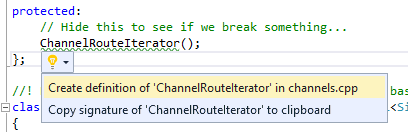
Visual Studio sometimes suggests ways to improve or complete your code. This comes in the forms of some lightbulb pop-ups called Quick Fixes. For example, if you declare a class in a header file, Visual Studio will suggest that it can declare a definition for it in a separate .cpp file.
Refactoring Features
Do you have a codebase that you’re not happy with? Have you found yourself needing to make sweeping changes but are afraid of breaking your build or feel like it will take too long? This is where the C++ refactoring features in Visual Studio come in. We provide a suite of tools to help you make code changes. Currently, Visual Studio supports the following refactoring operations for C++:
- Rename
- Extract Function
- Change Function Signature
- Create Declaration/Definition
- Move Function Definition
- Implement Pure Virtuals
- Convert to Raw String Literal
Many of these features are called out in our announcement blog post, All about C++ Refactoring in Visual Studio. Change Function Signature was added afterward, but functions exactly as you’d expect – it allows you to change the signature of a function and replicate changes throughout your codebase. You can access the various refactoring operations by right-clicking somewhere in your code or using the Edit menu. It’s also worth remembering Ctrl + R, Ctrl + R to perform symbol renames; it’s easily the most common refactoring operation.
In addition, check out the C++ Quick Fixes extension, which adds a host of other tools to help you change your code more efficiently.
For additional information, check our documentation on Writing and refactoring code in C++.
Code Style Enforcement with EditorConfig
Visual Studio 2017 comes with built-in support for EditorConfig, a popular code style enforcement mechanism. You can create .editorconfig files and place them in different folders of your codebase, applying code styles to those folders and all subfolders below them. An .editorconfig file supersedes any other .editorconfig files in parent folders and overwrites any formatting settings configured via Tools > Options. You can set rules around tabs vs. spaces, indent size, and more. EditorConfig is particularly useful when you are working on a project as part of a team, such as when a developer wants to check in code formatted with tabs instead of spaces, when your team normally uses spaces. EditorConfig files can easily be checked in as part of your code repo to enforce your team style.
Learn more about EditorConfig support in Visual Studio
Keyboard Shortcut Reference
For a full set of default key bindings for Visual Studio C++ developers, take a look at our Visual Studio 2017 Keyboard Shortcut Reference.
Conclusion
Lastly, you can find additional resources on how to use Visual Studio in our official documentation pages at docs.microsoft.com. In particular, for developer productivity, we have the following set of articles available:
- Writing Code in the Code and Text Editor – goes over more features in this area.
- Writing and refactoring code (C++) – provides some C++ productivity tips.
- Finding and Using Visual Studio Extensions – many community contributors submit both free and paid extensions that can improve your development experience.
 Light
Light Dark
Dark
1 comment
Thanks for the share! Anyway, We have some good stories here: 12 nu than
This is an Vietnamese story. Hope you enjoy it!