
December Update for the Visual Studio Code C/C++ extension
At //Build this year we launched the C/C++ extension for Visual Studio Code. Keeping with the monthly release cadence and goal to continuously respond to your feedback, this December update introduces the following features:
- Debugger visualizations by default with Pretty Printing for GDB users
- Ability to map source files during debugging
If you haven’t already provided us feedback, please take this quick survey to help shape this extension for your needs. The original blog post has already been updated with these new feature additions. Let’s learn more about each one of them now!
Debugger Visualizations by default with Pretty Printing for GDB users
Pretty printers can be used to make the output of GDB more usable and hence debugging easier. ‘launch.json’ now comes pre-configured with Pretty Printing enabled as a result of the ‘-enable-pretty-printing’ flag in the ‘setupCommands’ section. This flag is passed to GDB MI enabling Pretty Printing.

To demonstrate the advantages of pretty printing let’s take the following example.
#include <iostream> #include <string> #include <vector>
using namespace std;
int main() { vector<float> testvector(5,1.0); string str = “Hello World”; cout << str; return 0; }
In a live debugging session let us evaluate ‘str’ and ‘testvector’ without pretty printing enabled:
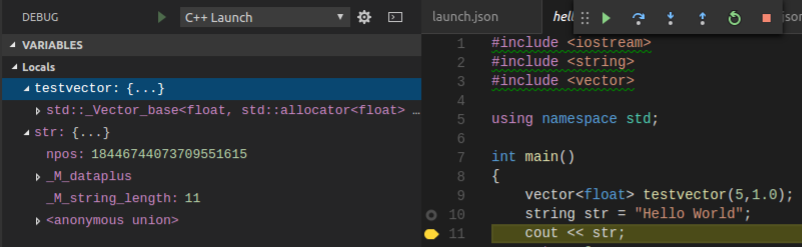
Look at the value for ‘str’ and ‘testvector’. It looks very cryptic…
Let us now evaluate ‘str’ and ‘testvector’ with pretty printing enabled:
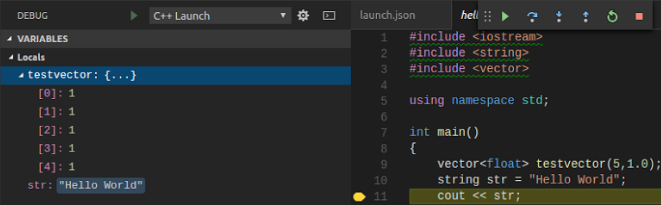
There is some instant gratification right there!
There is a selection of pre-defined pretty printers for STL containers which come as a part of the default GDB distribution. You can also create your very own pretty printer by following this guide.
Ability to map source files during debugging
Visual Studio Code displays code files during debugging based on what the debugger returns as the path of the code file. The debugger embeds source location during compilation but if you debug an executable with source files that have been moved, Visual Studio Code will display a message stating that the code file cannot be found. An example of this is when your debugging session occurs on a machine different from where the binaries are compiled . You can now use the ‘sourceFileMap’ option to override the paths returned by the debugger and replace it with directories that you specify.
#include "stdafx.h"
#include "..\bar\shape.h"
int main()
{
      shape triangle;
      triangle.getshapetype();
      return 0;
}
Let us assume post compilation the directory ‘bar’ was moved, this would mean when we are stepping into ‘triangle.getshapetype()’ function, the mapping source file ‘shape.cpp’ would not be found. This can now be fixed by using the ‘sourceFileMap’ option in your launch.json file as shown below:
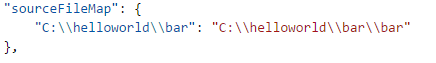
We currently require that both the key and the value be a full path and not a relative path. You may use as many key/value pairs as you would like. They are parsed from first to last and the first match it finds, it will use the replacement value. In entering the mappings, it would be best to start with the most specific to the least specific. You may also specify the full path to a file to change the mapping.
Update your extension now!
If you are already using the C/C++ extension, you can update your extension easily by using the extensions tab. This will display any available updates for your currently installed extensions. To install the update, simply click the Update button in the extension window.
Please refer to the original blog post for links to documentation and for more information about the overall experience of Visual Studio Code C/C++. Please help us by continuing to file issues at our Github page and keep trying out this experience and if you would like to shape the future of this extension please join our Cross-Platform C++ Insiders group, where you can speak with us directly and help make this product the best for your needs.
 Light
Light Dark
Dark
0 comments