
Examining stack traces of objects using Visual Studio 2013
It is quite common to have a program stopped in the debugger due to a crash or assertion caused by an object being in a bad state, and to track down the problem, you need to figure out how it got that way. In many cases, the call stack of the object’s creation can provide valuable clues, but trying to get that call stack can be a significant chore. The most obvious technique, setting a breakpoint at the object’s constructor, can become cumbersome when you have a large number of objects of the same type being created, only one of which, has a problem.
Here, we will explore an alternative approach where, by adding a small amount of instrumentation code, we can examine the object in the watch or locals window at the point of the problem and immediately see the call stack of the object’s creation.
First, we need code to actually capture the stack trace from inside our object’s constructor. Fortunately, Windows has done most of the work for us by providing a function, CaptureStackBackTrace(), which walks the stack a given number of frames, and stores the address of each frame it sees in a void** buffer. We begin by wrapping the function inside of a StackTrace class, which captures the stack trace in its constructor and stores it in a member variable, as follows:
   #include <Windows.h>
   class StackTrace {
       private:
           enum { NFrames = 20};
           int m_frameCount;
           void* m_frames[NFrames];
       public:
           StackTrace() {
               m_frameCount = CaptureStackBackTrace(1, NFrames, m_frames, NULL);
          }
   };
Now, all we have to do is stick one of these StackTrace objects inside of each class we are interested in recording the stack trace of. For example:
   class MyObject {
       private:
          // Existing members...
          StackTrace stackTrace;
      public:
         MyObject()  {
           // Existing constructor code...
        }
    };
Now, every time an instance of “MyObject” gets created, the stack trace of the creation, starting with the “MyObject” constructor, will be saved inside of the MyObject’s ‘stackTrace’ field. (To avoid adding unnecessary performance overhead to your application, it is recommended that you remove uses of the StackTrace class when you are finished investigating your problem, or wrap the use of the StackTrace class in “#ifdef _DEBUG” to exclude it from retail builds).
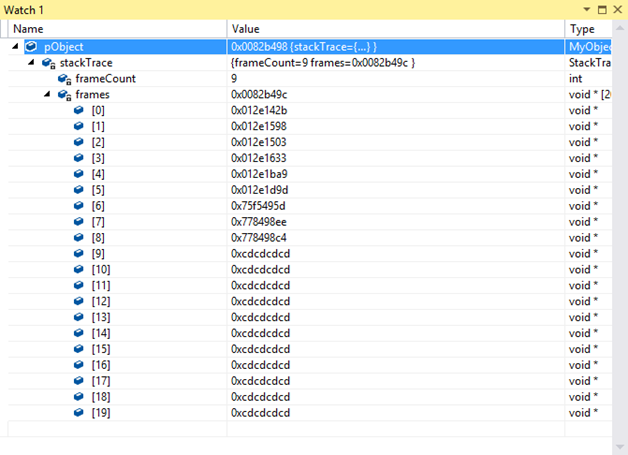
Everything we’ve done so far can be accomplished using any version of Visual Studio. However, when it comes to looking at the captured stack trace under the debugger and seeing something useful, Visual Studio 2013 is best. In prior releases, the contents of the stack trace would simply be a collection of opaque void*’s, like this:
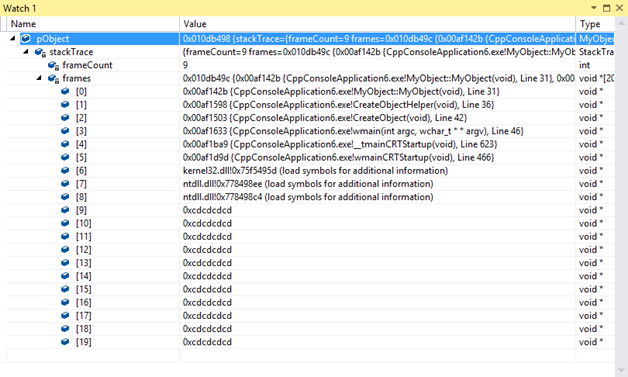
In Visual Studio 2013, however, the stack trace looks like this:
You can even right-click on a specific frame of interest to navigate to the source or disassembly, like this:
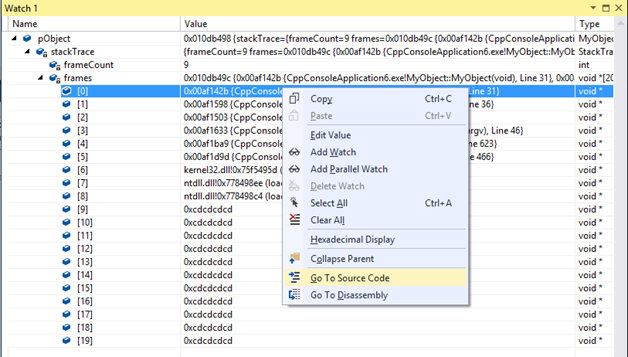
What we’ve seen so far does not require any special effort to enable – whenever the Visual Studio 2013 debugger sees a pointer to code inside of a function, the debugger automatically shows the name of the function and the line number, and allows source and disassembly navigation.
However, if you are willing to write a natvis entry, you can make the experience even better, like this:
   <?xml version="1.0" encoding="utf-8"?>
      <AutoVisualizer xmlns="http://schemas.microsoft.com/vstudio/debugger/natvis/2010">
         <Type Name="StackTrace">
            <Expand>
               <ExpandedItem>frames,[frameCount]stackTrace</ExpandedItem>
            </Expand>
         </Type>
      <Type Name="MyObject">
         <!-- Existing visualization for MyObject-->
         <Expand>
            <Item Name="[Stack Trace]">stackTrace</Item>
         </Expand>
      </Type>
   </AutoVisualizer>
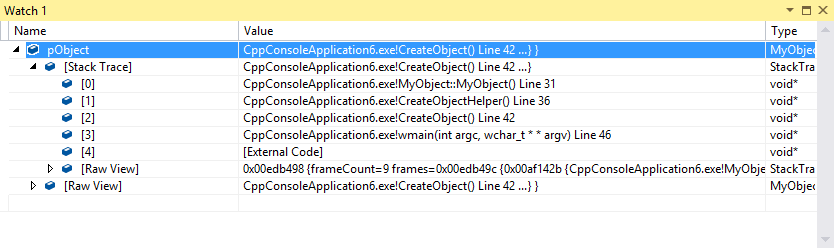
The above natvis entry does several things. First, it predominantly calls out the stack trace of MyObject so you don’t have to dig out of a potentially long field list. Secondly, the visualizer for the StackTrace class uses the array-length format specifier to avoid showing the unused sections of the stack trace buffer. Finally, it uses the special “,stackTrace” format specifier, which serves as a hint to the debugger that the contents of member variable “frames” actually represents the frames of a stack trace. In particular, the “,stackTrace” format specifier causes the debugger to omit the memory addresses of the frames, showing only the function, and to collapse frames which represent non-user code into an “External Code” frame if JustMyCode is enabled. In this example, the “[External Code]” block refers to the frames from kernel32.dll and ntdll.dll that comprise the start of every Windows thread.
Give it a try!
Eric Feiveson is a developer on the Visual C++ team at Microsoft. If you have questions, please post them in the comments.
 Light
Light Dark
Dark
0 comments