
Profile Guided Optimization (PGO) – Under the Hood
To introduce myself I am Ankit Asthana and I am the program manager for the backend C++ compiler. In my last few blogs I provided an introduction to what PGO is all about along with case studies which covered how Profile Guided Optimization (PGO) is used to make real world applications such as SAP NetWeaver and Windows PHP faster. In this blog I would like to talk about how PGO works under the hood and helps produce faster code. So let us take a look at how PGO helps the compiler backend in building an optimized version of an application. Once we know how PGO optimizations work, we can understand how PGO makes applications faster. So let’s get started!
How does PGO help build leaner and faster native applications?
Carrying on from my first blog let us take a look at the following code snippets again:
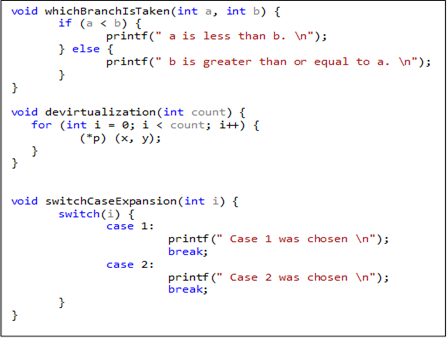
To recall, PGO helps optimize the application by leveraging profile data collected from running performance centric user scenarios. PGO’izing an application requires three basic steps (Instrument, Train and Optimize). Instrumenting an application means building with special compiler/link flags which insert probes into the generated code. These probes then when hit during the training phase collect data providing information on which branch was taken in the whichBranchIsTaken code snippet or what is the usual value of *p in the devirtualization code snippet as an example. This data collected by probes in the training phase is dumped into a database file *.pgd which is then supplied to the compiler as an input for the optimize phase of PGO.
During the optimize phase of PGO, the data collected in the database file is used as an input for a list of optimizations (table 1, below). Although the database file is used as an input for many optimizations, inlining and layout based PGO optimizations provide majority of the performance gains so let us take a look at how the training data collected helps in better inlining and layout based decisions.
| Full and Partial Inlining | Function Layout | Speed and Size decision |
| Basic Block Layout | Code Separation | Virtual Call Expansion |
| Switch Expansion | Data Separation | Loop Unrolling |
Table 1: Some optimizations gaining from PGO
Inlining decisions for PGO are based upon call graph path profiling. Simply put, the basic mantra behind using call graph path profiling for inlining decisions is to understand the behavior of a function being called from a specific call path. This is important as the behavior of a function call from one-call path may be drastically different from another call path. Having information on which call path is hotter helps in better inlining decisions as the optimizer only inlines frequent call paths hence minimizing the code bloat due to inlining but still gaining performance by inlining hotter call paths. Take a look at the example given below:
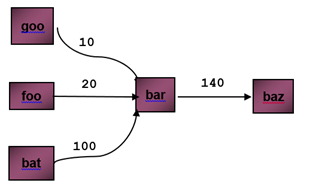 Figure 1a: Sequence of calls to function ‘bar’ from ‘goo’, ‘foo’ and ‘bat’
Example depicted in figure 1a above illustrates function calls being made to function ‘bar’ from function ‘goo’, ‘foo’ and ‘bat’. The number on the edge denotes how many times function ‘bar’ is called from function ‘goo’, ‘foo’ and ‘bat’ respectively. So the edge from function ‘goo’ to function ‘bar’ denotes that function ‘bar’ was called 10 times from function ‘goo’ for a given PGO training session. Now call graph path profiling is all about finding out the behavior of a function call from a specific call path. So figure 1a will be further broken down into figure 1b.
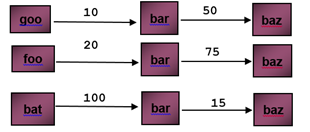
Figure 1b: Sequence of calls to function ‘bar’ from ‘goo’, ‘foo’ and ‘bat’ Sequence of calls to function ‘baz’ from ‘bar’
Analyzing figure 1b it becomes obvious that the major benefit will come from inlining function ‘bar’ into ‘bat’ given the higher frequency ‘i.e. 100’ of calls made from ‘bat’ to ‘bar’. Additionally it also is somewhat obvious that the other major advantage will come from inlining ‘baz’ into ‘bar’ given the high frequency of calls made to function ‘baz’ from call paths ‘goo-bar’ and ‘foo-bar’. The impact of pgo-inlining for the above scenario is shown below in figure 1c.
. 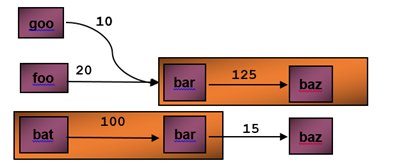 Figure 1c: Impact of PGO inlining, ‘bar’ is inlined into ‘bat’ and ‘baz’ is inlined into ‘bar’.
Inlining decisions are made before layout, speed vs size decisions and all other optimizations. Now from my last blog, let us recall the output (figure 2) of an optimized PGO build.
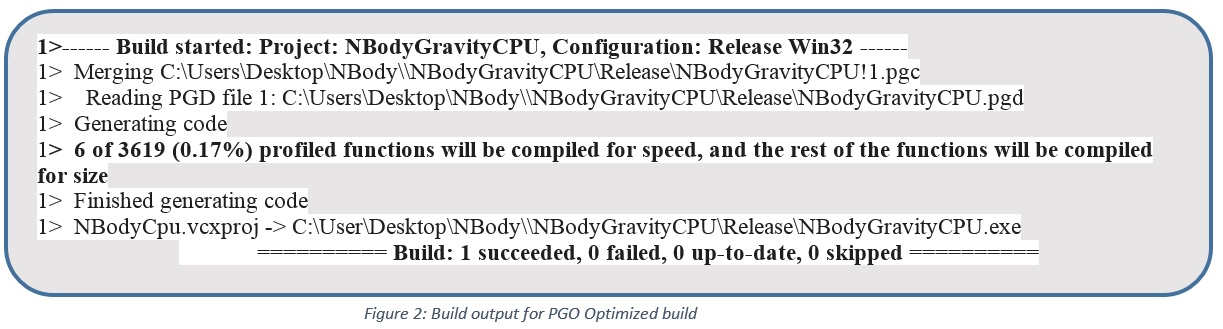
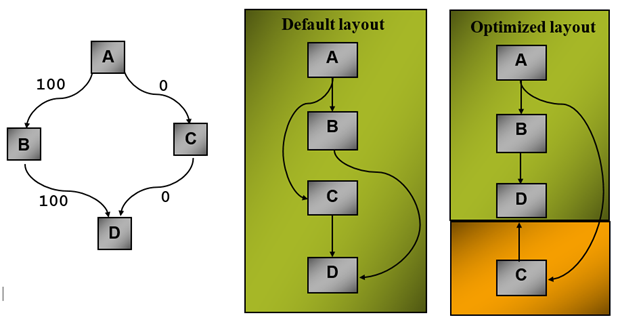
‘Speed vs. Size’ decisions are based on post-inliner dynamic instruction count. Code segments (i.e. functions) with higher dynamic instruction count are optimized for speed whereas code segments with lower dynamic instruction counts are optimized for size. In the build output shown in figure 2 above 6 of 3619 (0.17%) profiled functions will be compiled for speed, and the rest of the functions will be compiled for size is a result of this decision making process. The speed and size decisions are followed by ‘Block Layout’ and ‘Live and Scenario dead code separation’ optimization. Basic blocks are ordered so that most frequent paths fall through (figure 3). Live and Scenario dead code separation is performed to minimize working set and improve code locality. Code (functions/blocks) which are scenario dead (i.e. not exercised in the training scenario) are placed in a special section (figure 4).

![]()
Finally, based on the post-inliner and post-code-separation, call graph profile data function layout is performed. Only functions in the live sections are laid out. Dead blocks are not included. The overall strategy behind function layout is that functions which are strongly connected (calling each other with high frequency) are put together. A call is supposed to have achieve page locality if the callee is located in the same page. Take a look at the example in figure 6 below:
 Figure 6: Function layout based upon call graph and profile data
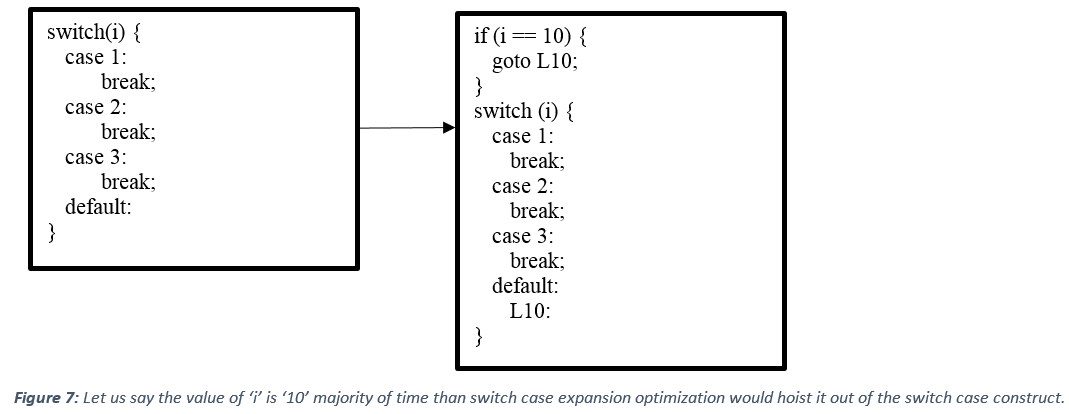
Some other optimizations that are performed based upon the training data are switch case expansion and virtual call speculation. The switch case expansion optimization uses the most common value of the switch expression that PGO collects and pulls it out of the switch construct. Take a look at how the code snippet presented at the start of this blog will be optimized using the PGO data when switch case expansion optimization is performed.
Similarly, if a virtual call, or other call through a function pointer, frequently targets a certain function, profile-guided optimization can insert a conditionally-executed direct call to the frequently-targeted function, and the direct call can be inlined.
Wrap up
Although Profile Guided Optimization (PGO) is a complex technology, this blog should provide you folks an idea on the usefulness of profile guided optimization and how PGO works under the hood to make plethora of products more performant. In my future blogs I will try to cover a best practices guide which covers common pitfalls and highlights some tips and tricks for PGO users. So stay tuned! Additionally, if you would like us to blog about some other PGO-related scenarios please let us know.
 Light
Light Dark
Dark
0 comments