
Build faster and high performing native applications using PGO
I am Ankit Asthana and I am the program manager for the backend C++ compiler. For today’s topic I want to blog about a really cool runtime compiler optimization called Profile Guided Optimization (PGO) (we on the team call it POGO or PGO for short). PGO was initiated by the Visual C and Microsoft Research groups in the late 90’s and primarily focused on Itanium architecture. PGO was eventually shipped as a part of Visual Studio C/C++ 2005 and is today a key optimization providing significant performance boost to Microsoft applications, applications from other companies and, after you read this article, perhaps even your application.
This blog provides guidance on how to build faster and higher performing native applications. First we take a look at PGO, then dive into how you can use PGO to boost the performance of your native application in a few simple steps using a sample application (NBody simulation). Grab the source code (attached) but install the required DirectX SDK first!
Building Faster Native Applications
Traditional compilers perform optimizations based on static source files. That is, they analyze the text of the source file, but use no knowledge about potential user input that is not directly obtainable from the source code. For example, take a look at the following pseudo-code:
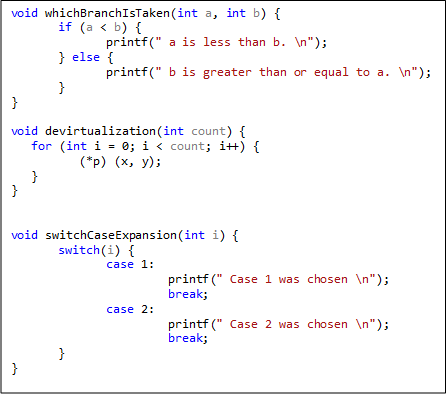
Textbox 1: Sample Code Snippets
When compiling whichBranchIsTaken function the compiler does not know how often ‘a < b’ and how many times the ‘if branch’ is taken (i.e no knowledge about branch prediction). When compiling the devirtualization and switchCaseExpansion functions the compiler knows very little about typical values of *p (prevents devirtualization optimization) and i (prevents switch expansion optimization). These issues are further magnified when these snippets are present in different source modules (i.e. different object files) as traditional compilation options do not optimize across source module boundaries.
The basic compiler and linker model is not particularly bad but it misses two major opportunities for optimization. First, it does not exploit information that it could gain from analyzing all source files together as traditional compilers only optimize a single object file. Second, it does not make any optimizations based upon expected/profiled behavior of the application. The first opportunity can be leveraged and fixed by using the (/GL) compiler switch or the (/LTCG) linker switch which performs whole program optimization and is a prerequisite for being able to PGO’ize an application. Once whole program optimization has been enabled you are then ready to PGO’ize your application. So let us now really get into what PGO is all about.
PGO is a runtime compiler optimization which leverages profile data collected from running important or performance centric user scenarios to build an optimized version of the application. PGO optimizations have some significant advantage over traditional static optimizations as they are based upon how the application is likely to perform in a production environment which allow the optimizer to optimize for speed for hotter code paths (common user scenarios) and optimize for size for colder code paths (not so common user scenarios) resulting in generating faster and smaller code for the application attributing to significant performance gains.
![]()
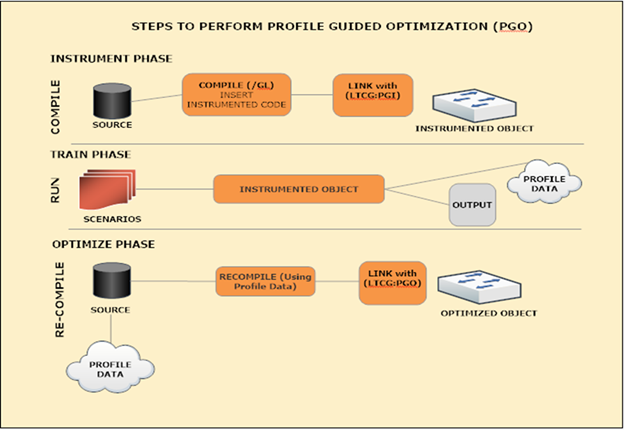
Figure 1: Three phases of PGO
PGO can be currently be used only on traditional desktop applications and is supported on x86 and x64 platforms. Performing PGO is essentially a three-phase process as shown graphically in the figure above:
The first phase is known as the instrumentation phase. This phase requires building (i.e. ‘compile’ in figure 1) the application with a special set of build flags. During this build the backend compiler inserts probe instructions into the generated code which are used to record training data for the next phase. The three types of probes inserted are (function entry probes, edge probes, and value probes). The function entry probe is used to collect information on how many times a function was called, the edge probes are used to collect occurrence count on how many times a particular edge is taken. Using the data collected from the edge probe in the training phase the compiler can understand how often is ‘a > b’ for the whichBranchisTaken code snippet given a particular training scenario. Value probes are special because they are used to construct a histogram of values. For example, in the switchCaseExpansion code snippet a value probe will be inserted which will be used to construct a histogram of values for the switch case index variable i. Knowing the typical value of ‘i’ from the training phase the compiler can then optimize for the common case and perform optimizations such as switch case expansion. To summarize, the end result of this phase is an instrumented version of the application (with probes) and an empty database file (.pgd file) which is used to hold training data for the next phase.
The second phase is the training phase (i.e. ‘run’ in figure 1). In this phase the user runs the instrumented version of the application and exercises only common performance centric user scenarios. Exercising these training scenarios results in creation of (.pgc) files which contain training data correlating to each user scenario. The training data being collected here is being dumped from the probes inserted in the instrumentation phase. Training for these scenarios results in creation of appname!#.pgc files (where appname is the name of the running application and # is 1 + the number of appname!#.pgc files in the output build directory).
The last PGO phase is the optimization phase (i.e.’re-compile’ in figure 1). In this phase the application is rebuilt for the last time to generate the optimized version of the application. Behind the scenes, the (.pgc) training data files are merged into the empty program database file (.pgd) created in the instrumented phase. The compiler backend then uses this program database file to make more intelligent optimization decisions on the code generating a highly optimized version of the application.
A common misconception among PGO users is to believe that all three steps (Instrumentation, Training and Optimization) need to be performed by the end user every time the product is built. This is not true, an optimized PGO build can be built repeatedly (without the instrumentation and training step) until the source base has vastly diverged from the last time the application was PGO-trained. For large development teams, an ideal workflow is for one developer doing PGO and checking the training data (.pgd) into the source repository. Other developers in the team should then be able to sync their code repositories and use the training data file to directly build PGO optimized builds. When the counts go stale over period of time, the applicpation is PGO-retrained.
Using Profile Guided Optimization
Now that we know a little about what PGO is all about, let us get some hands on knowledge on how to enable PGO for our native application. Applications can be PGO’ized using both Visual Studio and Developer command prompt. For the purposes of this blog we will be focusing on PGO’izing applications (Nbody Simulation sample) from the Visual Studio. If you are curious about using PGO from the command line, see these articles. Once you have loaded up the solution in Visual Studio (figure 2) and you have chosen the production build configuration (i.e. Release) you are all set to go.
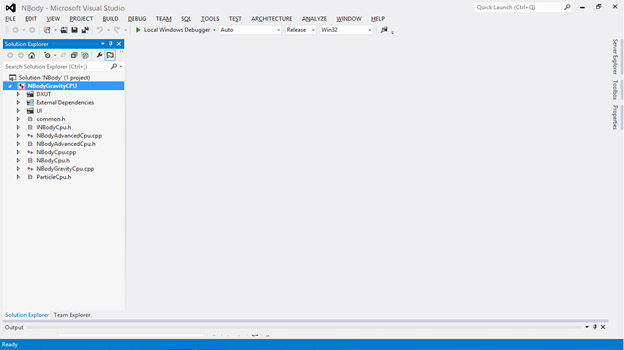
Figure 2: NBody solution loaded up in Visual Studio
Remember from the previous section PGO’izing your application is a three step process (Instrument, Train, and Optimize). To create the instrumented version of the application right click on the project (i.e. ‘NBodyGravityCPU’) and choose ‘Instrument’ under the ‘Profile Guided Optimization’ menu as illustrated in figure 3 below.
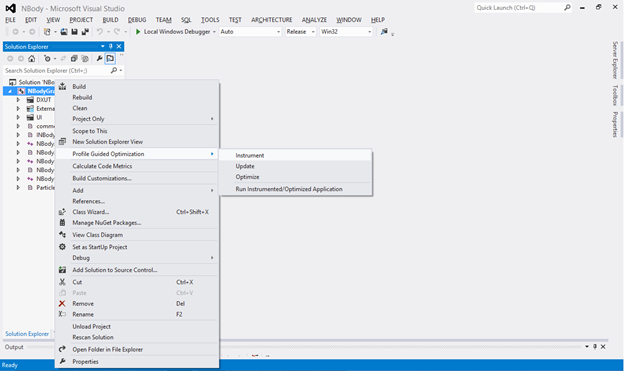
Figure 3: Creating an instrumented version of your application
This will result in Visual Studio building an instrumented version of your application. Once the instrumented version of your application is complete we can move on to the training phase for your application. Launch the instrumented version of your application by using the ‘Run Instrumented/Optimized Application’ menu item under the ‘Profile Guided Optimization menu’. In case of this sample application letting the sample run with max bodies (15360) is a reasonable training scenario as this is the bread and butter performance-centric steady-state user scenario. After the FPS (Frames per second) and GFlop which are key performance indicators for this application have stabilized (figure 4) you can close the application. Closing the application completes the training phase and flushes training data into the .pgc file. The .pgc file by default will be present in your ‘build configuration, i.e. Release’ directory. For example, as a result of this training NBodyGravityCPU!1.pgc was created.
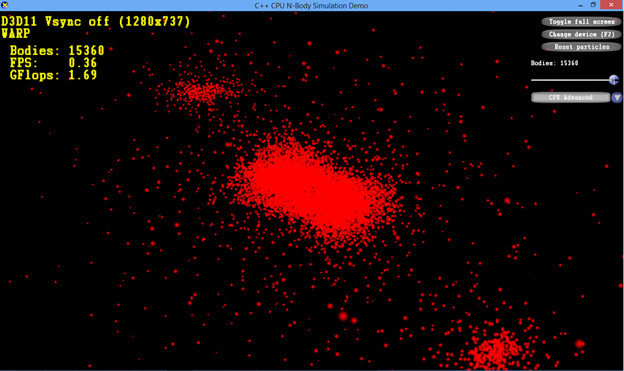
Figure 4: NBody Simulation Application
Please note, the N-Body simulation sample is a fairly simple application and only used to explain the flow for performing PGO. It is natural for applications to have numerous complex training scenarios. For example, a user might have training scenarios which are disjoint and happen within an interval of execution or time. For recording these kind of training scenarios the best way is to use the pgosweep command line tool from an elevated developer command prompt once the instrumented build has already been built (from Visual Studio).
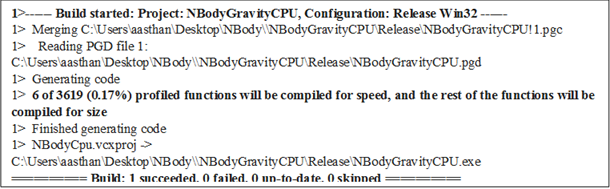
Textbox 2: PGO Build output log
The last phase of performing PGO is creating the optimized version of the application. From the Profile Guided Optimization menu now select ‘Optimize’ (figure 3). This will trigger an optimized build for your application. If you eye-ball the build log you will see the following text section summarizing PGO activity.
As mentioned earlier in this blog, during the optimized phase the training data files ‘.pgc(s)’ are merged into the program database files ‘.pgd’ which are then used by the backend compiler optimization matrix. In general, except for small programs in which all functions are built for speed, the criteria to optimize for speed vs. size is simply determined by the % of dynamic instruction count for a given function. Functions with high instruction counts (i.e. hot) are compiled for speed whereas functions with lower dynamic instruction counts (i.e. cold) are compiled for size.
As a general rule of thumb for a medium or large component, there should be <5 % methods compiled for speed. Once the optimized version of the application has been built you are ready to run your training scenarios on the optimized application to measure performance gains.
At this point you should be all equipped to try out PGO for your native application. Give it a try and get back to us. My next blog will cover in detail a few case studies for PGO and talk about how PGO under the hood optimizes your application, so stay tuned! If you would like us to blog about some other PGO-related scenarios let us know J.
 Light
Light Dark
Dark
0 comments