
Guest Post – The Expression Evaluator
Hi. My name is Ofek Shilon and I blog mostly about various VC++ tricks I come by. Today I’d like to explicitly introduce a debugging feature we all use daily but seldom refer to it by name – the native expression evaluator (abbreviated EE below).
The Basics
Every time you use the Watch window, a lot is going on behind the scenes. Whenever you type a variable name, something needs to map that name to the memory address and type of the named variable, then display that variable, properly formatted based on its type. Conversely, when you modify the contents of a variable – something needs to take your text input, convert it to the right type and correctly update the memory at the right address.
That something is the Expression Evaluator. It is an impressive and often overlooked piece of technology and once familiar with it, you can put it to good use, sometimes in surprising ways!
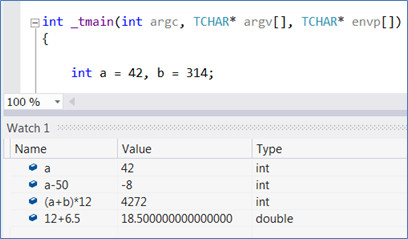
As the component name suggests, it is in fact able to parse and evaluate expressions:
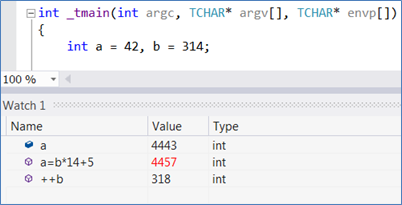
These expressions can be assignment statements or can otherwise modify variables, too:
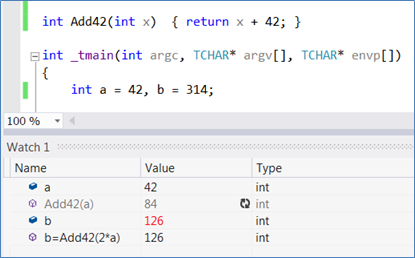
And more importantly – the expressions can include function calls!
The EE lives in various IDE contexts—the Watch window, the QuickWatch dialog, the Immediate window, Breakpoint conditions and a bit more – but it is most obvious (and most frequently used) in the various Watch windows. When expertly used this feature can raise debugging interactivity to surprising levels, and in fact comes rather close to being a full C++ interpreted environment (especially alongside Edit and Continue). However, there are several important differences between expression evaluation and real code compilation that you should be aware of.
Calling functions
What can and can’t be called
The EE cannot call inlined functions, as they are not really ‘there’ as code to be called. On the upside, the EE is blind to access privileges and would happily evaluate calls to private methods or file-static functions.
Side effects
The expressions are being evaluated at the context of the currently selected thread (that is, the one whose stack, registers and local variables are shown in the corresponding IDE windows). In particular, expressions are evaluated in the debuggee’s address space, which could have unexpected consequences if one isn’t careful. For example, suppose you’re trying to evaluate an expression which allocates heap memory – but a different thread is frozen holding the heap lock. The debuggee would be left in an unknown state and the IDE should take measures against hanging by itself! Many similar scenarios might occur: since all debuggee threads are frozen various resources might be in unstable states and one should be careful when messing with them. That line of thought is probably what caused the EE designers to explicitly forbid usage of a large subset of CRT and WIN32 API. The full list of banned APIs is an implementation detail and is subject to change between versions or in updates (and was indeed expanded considerably in VS2010).
However,
(1) In practice, side effects as described are extremely rare, and I’ve been messing interactively with debuggee state for years with no problems.
(2) The tests against this list are shallow, and you can easily bypass them by wrapping API in the list with your own functions (in advance, i.e. at the source itself):
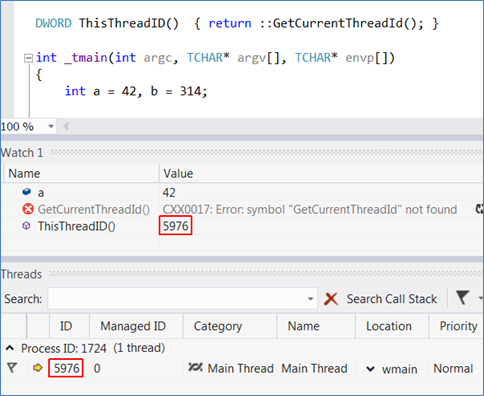
All that being said, such bypasses are undocumented and unsupported – use them at your own risk!
The Context Operator
The EE does not include a full-fledged linker, and when you call functions outside the main executable the EE might require help in resolving the call. You can deliver that help with the context operator:
{,,DllName.dll}FunctionName()
(You can also omit the ‘.dll’ in the module name. )

Some Rough Edges
As useful as it is, the EE parsing and symbol resolution will probably never be as robust as the compiler’s – and sometimes some workarounds are in order.
Symbols sometimes need to be ‘resolved manually’ by taking addresses and casting:

Enum types are mostly recognized, but individual enumerators (enum values) are not. Implicit casting to an enum type can fail too. Luckily, you can easily cast the raw integral values yourself:

If symbols reside in namespaces, they must be fully qualified. If functions are template, the template types must be fully (sometimes very verbosely) specified. You may come across other similar behaviors. As a rule of thumb, when things aren’t going as you expected – try to be as explicit as possible.
Applications
Finally, here are some examples of real life usage – specifically, enhanced investigation of memory issues in debug builds.
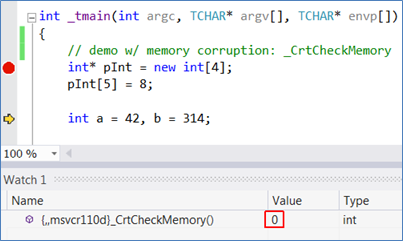
_CrtCheckMemory essentially walks the CRT heap and detects out-of-bound writes by inspecting the padding that CRT inserts at the end of allocated blocks. Now you can pin-point the origin of corruptions without repeatedly spreading _CrtCheckMemory at the source and recompiling. Here’s an evaluation right before a corruption:

And here it is again two lines later (after clicking refresh, to re-evaluate):
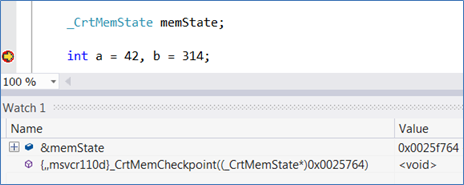
If you define a _CrtMemState slot at the source, you can populate and inspect it interactively using the many tools the CRT supplies. First fill it:
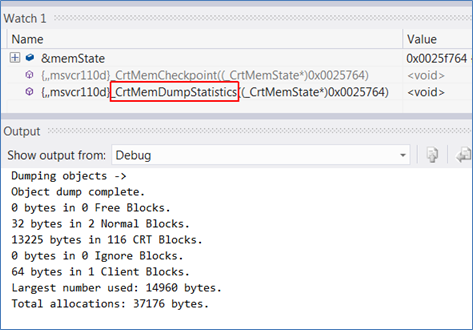
Then explore its contents – the CRT APIs ultimately call OutputDebugStringA , which still dumps to the output window:
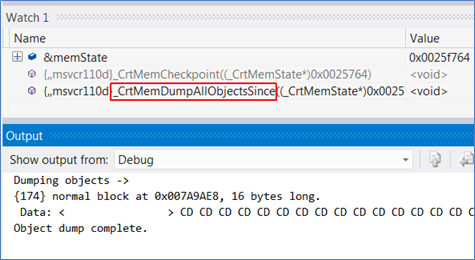
You can also reserve several _CrtMemoryState’s at the source, populate them at different locations and diff them with _CrtMemDifference. And so forth – you get the idea.
Bottom Line
Hopefully that’s enough as an intro to this underappreciated debugging feature. I’d love to hear (via the comments, my blog or just ofekshilon-at-gmail) whether all this works out for you, and of other cool directions you’re taking it to.
My deep thanks goes to Eric Battalio and James McNellis, for making this post happen and then improving it.
Cheers,
-Ofek
Thanks for the great article, Ofek. Readers, if you have an idea for an article that might appeal to the Visual C++ / C++ community, ping me @ ebattali@microsoft.com. I encourage you to ping me even if you think you can’t write, the topic might not fit, or you have any other reservations! 🙂
 Light
Light Dark
Dark
0 comments