
Game Debugging in Visual Studio 11
Hi! I am Amit Mohindra, a Program Manager on the Visual C++ team.
We believe Metro style games and graphics-intensive apps present a huge opportunity for developers on new devices such as tablets. The primary API for accessing the full power of the underlying graphics hardware on Windows is DirectX 11 (including Direct3D and Direct2D).
One of the most significant innovations we have brought to Visual Studio 11 is a series of tools for assisting you in developing Direct3D games. We made a quick video of some of these features on Channel9 (link). In this post, I will walk through our debugging & diagnostics support for D3D.
The new Graphics Debugger in Visual Studio is a debugging and analysis tool that captures detailed information from a Direct3D application as it executes. You can use it to:
- Capture rendered frames for later inspection and analysis.
- View DirectX events and their effects on the application.
- View 3D meshes before and after vertex shader transformations.
- Discover which DirectX events contribute to the color of a specific pixel.
- Jump directly to the location in source code for a particular DirectX call
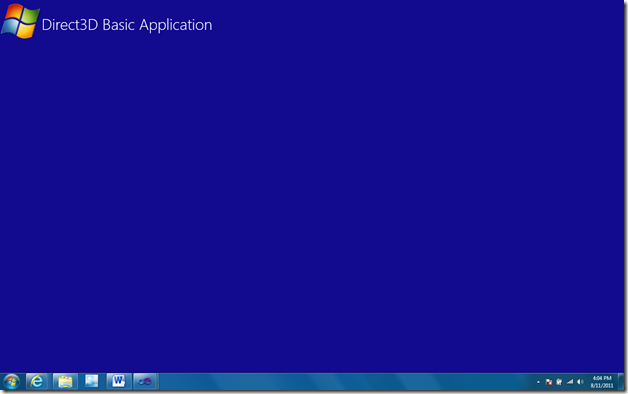
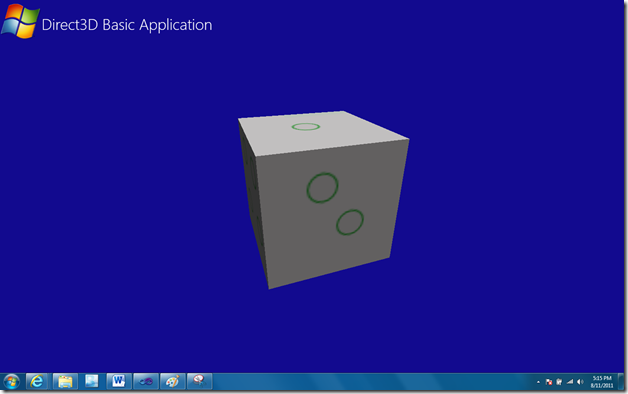
Let’s try to hypothetically solve a simple problem step by step using the graphics debugger. For this blog the game we’re working on is a rotating Die game. Here is what it should look like.

However, when we run the application we find out that the Die does not get rendered in the game.
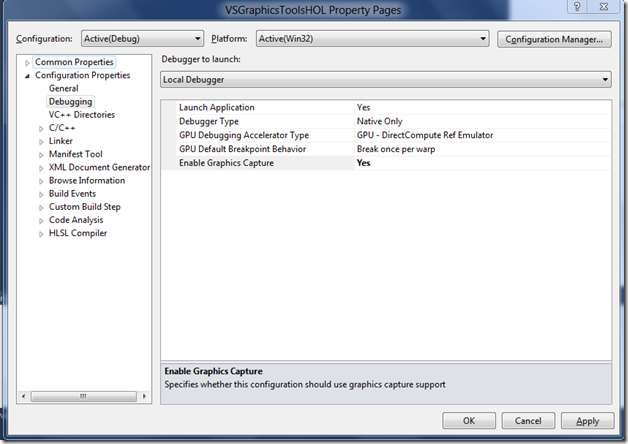
To start debugging this game, right-click on the project in Solution Explorer and set “Enable Graphics Capture” to “Yes” in the Debugging node.
Now, F5 to start debugging your application and you will notice that the game now has some fundamental statistics displayed in the top left corner. This indicates that VS is ready to capture diagnostic information from the game for you to investigate the rendering issues.

In order to capture a frame, just hit the “Print Screen” key. You can repeat this as often as you like; each frame will show up in Visual Studio as part of the “Graphics Experiment.vsglog” file. The log file contains all the information required for you to debug the rendering issues. The file by default is located in a temporary location, but you can choose to save the file and share it with other developers.
Let’s dig further into what’s going on by analyzing the captured frame in Visual Studio. To understand it better I want to know what got drawn when I called the “DrawIndexed” API in my code.
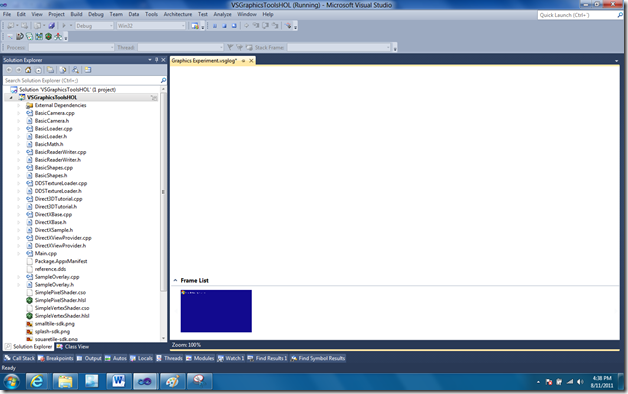
To inspect the “DrawIndexed” call right-click on the frame thumbnail and select “Events List” from the context menu to bring up the events list window.
The Graphics Event List window lists all the DirectX events captured by running a program under the VS debugger. It also simulates the events under the graphics debugger, re-running the commands using the same inputs as used by the running program. In the search box you could type “Draw” to filter the list to show the DirectX draw calls. Clicking through the draw calls you will be able to see in the frame window (on the right) how that frame was drawn piece by piece.
In the search box in this window type “Draw”, this will filter the list to show the draw calls made by the game. Select the “DrawIndexed” call in the events list and check to see in the frame window if something gets rendered.
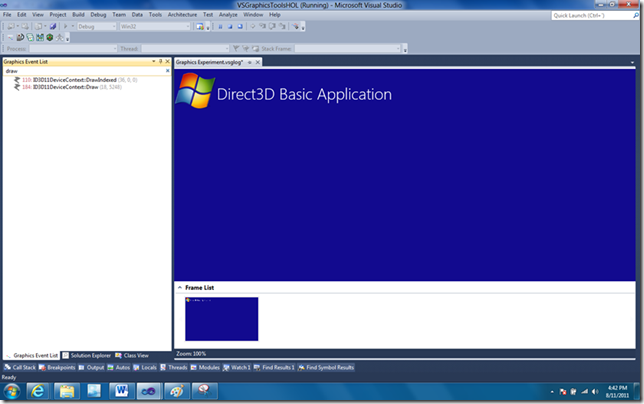
Unfortunately in this scenario as seen above nothing is rendered so we need to continue our debugging process. A draw API (DrawIndexed) submits work to the rendering pipeline. So let’s inspect the rendering pipeline to see if something was submitted as part of the “DrawIndexed” call. In order to see what was going on in the graphics pipeline when the draw call was executed, right-click on the call in the events list and bring up the pipeline viewer by selecting “Pipeline Viewer” from the context menu.
The Graphics pipeline viewer shows the different stages in the graphics pipeline and how those stages modify your model.
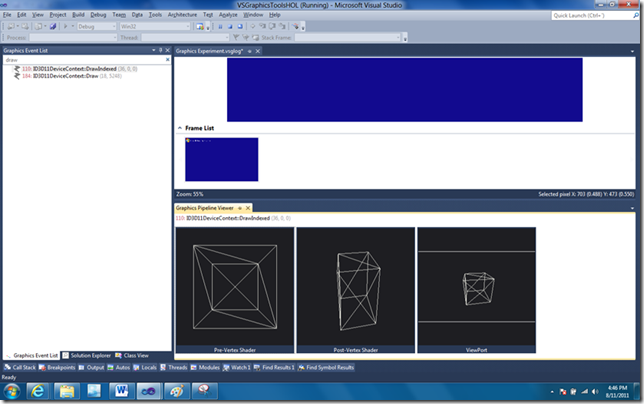
The viewer shows four different views of the mesh data; these correspond to four different stages in the pipeline
| View | Description |
| Pre-Vertex Shader | View the mesh vertices before the vertex shader. The camera is pointed at the center of the object. |
| Post Vertex Shader | View the mesh vertices after the vertex shader. The camera is pointed at the center of the object. |
| Geometry Shader (not seen in this example as it is not used) | View the mesh vertices after the geometry shader. The camera is pointed at the center of the object. If there is no geometry shader assigned, this view is blank (a solid shade of light gray). |
| View Port | View the mesh vertices in screen space. The camera is set up identical to the camera in the target program. |
Note there are other stages in the graphics pipeline which are not represented in this view. For more on the new graphics pipeline stages in DirectX 11, see here.
In the graphics pipeline view you can see that something is being drawn that looks like the Die that the application wanted to render. It seems from the figure above that the “Die” (cube) structure is going through the graphics pipeline correctly indicating that the shaders are functioning correctly (they aren’t modifying the original structure in a way that would prevent them from being rendered).
At this point we need to continue debugging and take a look elsewhere. It could be that the pixels being overwritten or discarded. To verify this hypothesis lets go take a look at the pixels in the center of the frame (where the Die is supposed to be rendered). In the frame buffer window click in the center to first select a pixel and then right click and choose “Pixel History” from the context menu.
The Graphics Pixel History window displays the activities that contribute to the color of the selected pixel in the current frame. It contains information about how the pixel was modified by each DirectX event in the pixel history window. This includes the initial frame buffer state, followed by the intermediate draw events of rendering and the final result.
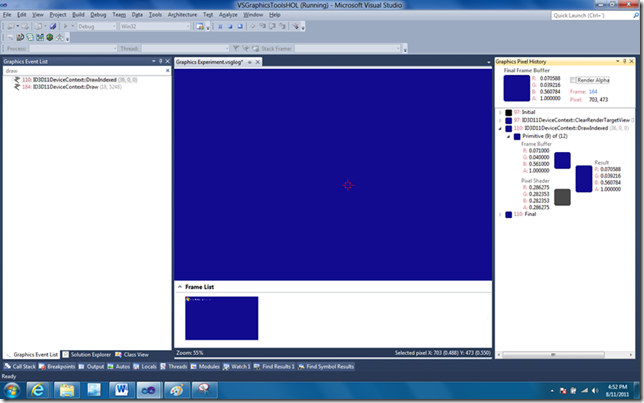
We can see from the “Pixel History” window that the frame buffer color for the pixel was blue, and then the pixel shader applied a different color (grey) to the pixel. However, the final color is still blue. The desired pixel color being rendered is not getting applied at all. This is an indication that the blend state might not be set correctly. Blend state controls how color and alpha values are blended when combining rendered data with existing render target data. To inspect the blend state, right click on the pixel and choose “Object Table” from the context menu. This will pop up the “Graphics Object Table” window.
The Graphics Object Table displays Direct3D objects created by the target program. Any object that contains state information can be viewed by double clicking on the object in the table.
Sort the object table (by “Type”) and then scroll to the list of “D3D11 Blend State” object. Double click on the “D3D11 Blend State” object will the lowest valid (not N/A) “Usage Age”. “Usage Age” helps scope the object to investigate in relation to the selected draw call, lower the usage age the more relevant it is. Double click on the blend state object with the lowest usage age and it will open a document with details of the object inside Visual Studio.

From the picture above we can see:
We can see from this that the blend state for the source is being masked since it is set to zero (D3D11_BLEND_ZERO) and the blend state for the destination is set to one (D3D11_BLEND_ONE). This causes the background color to come out as the primary color after blending thus we don’t see the Die being rendered. The values should be switched such that the output of the pixel shader is primary output of the blending operation.
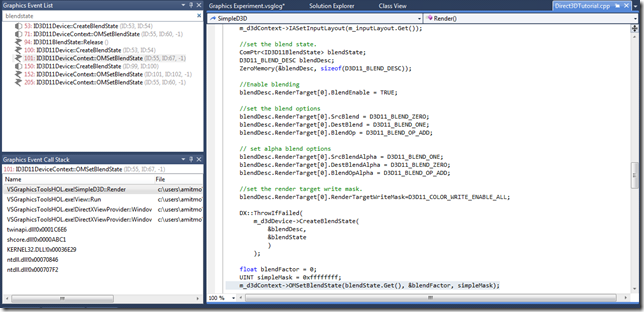
To find out where the blend state is being set we can go back to the event list window and filter the event list to look for “blendstate” since the event list lists all the DirectX events that transpired for the captured frame. Once you filter you can see calls to “OMSetBlendState”. “OMSetBlendState” is the call that sets the blend state. To get to the source code where this call is being made right click on the “OMSetBlendState” call and chose “Call Stack” from the context menu to bring up the “Graphics Call Stack” window
The Graphics Event Callstack window ties the DirectX events to the C++ source code being debugged.
Double click on the first call in the call stack and it takes you to the “OMSetBlendState” call in the code. A few lines above the “OMBlendState” call and you will notice the lines of code where source and destination blend values are set.
Switch the two states by changing the code to reflect the following:
Build and Run.
Summary:
Game development isn’t easy and we think tools should help you make use of the underlying DirectX platform. In this release, we are excited to bring this new type of diagnostics experience directly into Visual Studio. These features are still under development and could potentially change or not even be included in our final product. These features are only available of Visual Studio Professional and above SKU’s.
 Light
Light Dark
Dark
0 comments