
The ATL/MFC Trace Tool and the Tracing Mechanism
Hi, I am Pat Brenner, a Software Design Engineer in the Visual C++ Libraries group. Some time back I wrote about Spy++. Today, I am going to write about another Visual Studio debugging tool, the ATL/MFC Trace Tool, and the tracing mechanism that it interacts with in ATL and MFC.
The tracing mechanism
The tracing mechanism is used to control the type of information, and the amount of that information, that is dumped to the output window during execution of a program. There are a number of categories of information, and different levels of that information, that can be
displayed.
The tracing macros
An application can output tracing messages to the output window by:
· using the ATLTRACE macros (for ATL), defined in atltrace.h.
· using the TRACE macros (for MFC) defined in afx.h.
There are uses of the ATLTRACE and TRACE macros sprinkled throughout the ATL and MFC source code. For example, in CStringT.h in the atlmfc\include folder, in the CStringT::CheckImplicitLoad method, you can find this line of code:
ATLTRACE( atlTraceString, 2, _T( “Warning: implicit LoadString(%u) failed\n” ), nID );
This will dump the message to the output window if level-2 messages in the string category are turned on.
The ATL/MFC Trace Tool
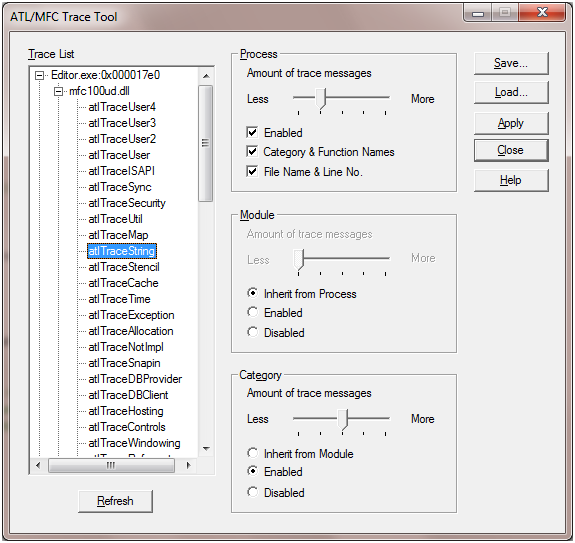
Below is a screen shot of the ATL/MFC Trace Tool. An MFC application named Editor.exe is running. The “atlTraceString” category is selected for the MFC100UD.DLL module in the Editor.exe process. Since a category is selected in the tree, all three of the groups (Process, Module and Category) are enabled. If the Editor.exe process was selected in the tree, only the Process group would be enabled, and if the MFC100UD.DLL module was selected in the tree, only the Process and Module groups would be enabled. With this tool, you can configure exactly what categories you would like to see trace messages for, and what amount of messages in those categories. Here I have indicated that I would like to see a fairly minimal number of trace messages for the entire process, and that the module should inherit the settings from the process, but I have overridden those values and indicated that I want to see a moderate number of trace messages in the string category.
ATL tracing categories
The categories of trace information that can be dumped by ATL:
· atlTraceGeneral: general and miscellaneous trace messages
· atlTraceCOM: COM object and method trace messages
· atlTraceQI: QueryInterface trace messages (category not used in ATL or MFC)
· atlTraceRegistrar: registration trace messages
· atlTraceRefcount: reference count trace messages (category not used in ATL or MFC)
· atlTraceWindowing: Windows message trace messages
· atlTraceControls: ActiveX control related trace messages
· atlTraceHosting: in-place client/site related trace messages
· atlTraceDBClient: database client related trace messages
· atlTraceDBProvider: database provider related trace messages
· atlTraceSnapin: snap-in related trace messages
· atlTraceNotImpl: “interface not implemented” trace messages
· atlTraceAllocation: memory allocation trace messages
· atlTraceException: “exception thrown” trace messages
· atlTraceTime: COleDateTime related trace messages
· atlTraceCache: caching related trace messages (category not used in ATL or MFC)
· atlTraceStencil: stencil related trace messages (category not used in ATL or MFC)
· atlTraceString: CStringT related trace messages
· atlTraceMap: CAtlMap related trace messages
· atlTraceUtil: thread and thread-pool related trace messages
· atlTraceSecurity: CSecurityDesc/CAccessToken related trace messages
· atlTraceSync: synchronization object related trace messages
· atlTraceISAPI: ISAPI related trace messages (category not used in ATL or MFC)
· atlTraceUser: user-defined trace messages (obsolete category not used in ATL or MFC)
· atlTraceUser2: user-defined trace messages (obsolete category not used in ATL or MFC)
· atlTraceUser3: user-defined trace messages (obsolete category not used in ATL or MFC)
· atlTraceUser4: user-defined trace messages (obsolete category not used in ATL or MFC)
Note: the categories that are not used internally by ATL or MFC will probably be removed in a future version of ATL, in order to clean up the interface in the ATL/MFC Trace Tool.
MFC tracing categories
The categories of trace information that can be dumped by MFC:
· traceAppMsg: main message pump trace messages, including DDE
· traceWinMsg: Windows message trace messages
· traceCmdRouting: Windows command routing trace messages
· traceOle: special OLE callback trace messages
· traceDatabase: special database trace messages
· traceInternet: special internet client trace messages
· traceDumpContext: trace messages from CDumpContext
· traceMemory: generic non-kernel memory trace messages
· traceHtml: HTML trace messages
· traceSocket: socket trace messages
Tracing levels
The information dumped by the trace mechanism is assigned a level from 0 (zero) to 4, where 0 is the most important level and 4 the least important. These levels correspond to the five ticks on the sliders in the ATL/MFC Trace Tool.
Tying it together
So, based on the settings I set in the ATL/MFC Trace Tool above, the source line above in CStringT.h will dump out the message to the output window, because although I have indicated that I want only level-0 and level-1 messages from the process, I want level-2 messages in the string category.
How it works
When a module is loaded that is using debug ATL (ATLSD.LIB), part of the initialization process is the initialization of the global CAtlAllocator object g_Allocator (see externs.cpp in the atlmfc\src\ATL\ATLS folder). This method creates a named shared memory area, and part of the name is the process ID (e.g., for process EB0A, the shared memory area is named “AtlDebugAllocator_FileMappingNameStatic_100_EB0A”). This shared memory area is used to contain all the settings for the process, modules and categories that can be modified by the ATL/MFC Trace Tool.
When the ATL/MFC Trace Tool is started up, it first enumerates all the process in the system, and for each, checks to see if a named shared memory exists for that process (using the naming scheme mentioned above. If so, then the tool loads up all the settings for that process and from then on is able to modify the settings for the process in the shared memory area, thus affecting the runtime trace behavior of that process.
An interesting recent discovery
We have implemented support in ATL and MFC for preview, thumbnail and filter (search) handlers. These are loaded by the Windows Explorer and other Windows components (including the Windows Search service). Recently we had an issue where the Windows Search component could not load our debug DLL, so we never got search filter results in indexed locations. As it turns out, this was because the search filter host (which loaded the ATL filter handler DLL in order to do the indexing) was running without any file system permissions. The ATL tracing mechanism, however, tries to set up the shared memory area (for communication with the ATL/MFC Trace Tool) using the CreateFileMapping API. The lack of file system permissions caused this to fail, and the DLL initialization was aborted, and thus our filter handler was not called. Apparently this is an issue that has lurked in ATL since the tracing mechanism was invented. So, in order to fix this issue, I had to allow DLL initialization to continue if the tracing initialization failed, and then simply bail out of any further calls into the tracing mechanism if the initialization had failed. This then allowed the DLL to load and the filter handler was called correctly, and the bug was fixed.
I hope this has been interesting. Let me know if you have any questions.
Pat Brenner
Visual C++ Libraries Development
 Light
Light Dark
Dark
0 comments