Analyzing CPU traces from Linux with PerfView
Executive Summary
If you want to use PerfView to view Linux profile data see the Help->Viewing Linux Data menu item.
The Details
As its name suggests, PerfView is a tool that is intended to help analyze (View) performance data. Most of the most interesting data on a Windows operating system came from operating system's Event Tracing for Windows (ETW) facility, and thus PerfView is often thought of as a view for ETW data. This is not incorrect but it is also limiting.
In particular, most of the views in PerfView are what are called the 'Stack Viewer' which is the view that gets shown when you do CPU, wall clock or most memory investigations. Well this the stack viewer is actually got almost nothing to do with ETW. Its job is to display a set samples, where each sample contains
- A Timestamp (this is optional, defaults to 0)
- A Metric (this is also optional and defaults to 1)
- A Stack (which is logically simply a list of strings (one per frame).
And that is all that is required. All the rest of the 'magic' of the view: its ability to form the stacks into a tree, create groups from the names, fold names away, filter some of the stacks, and display the various caller and callee and byname views are built on this data model.
Thus the stack viewer can take a wide range of possible input sources. In fact the code calls this model a 'StackSource' and makes it relatively easy to read an arbitrary format into this data structure, so which can then be displayed in PerfView in the stack viewer. This is SUPER USEFUL because it means that if have a profiler that can spit out its data as a set of timestamped stacks, then it is pretty easy to make PerfView view it (and thus get all the power of PerfView's grouping, folding and filtering).
Enter Linux
Well, you may know that the .NET Core Framework now runs on Linux, and so that means we need to do performance investigations on Linux. There is a mechanism in Linux which can do OS wide CPU sampling call Perf Events, which can used to do such investigations, however its viewer is painfully limiting if you are used to PerfView. (As an aside, something called 'flame graphs' seems to be popular on Linux, and I believe is popularity is a direct result of limiting nature of the default Linux performance viewer). The natural solution for us was simply to write a reader that reads the Linux Profile data as a StackSource.
Like ETW, the Linux Perf instrumentation is wired into the OS kernel and generates a binary format that represents the data and stacks it collects (traditionally called the perf.data file). Its viewer can directly view this binary format, but it can also be told to convert the format into a textual representation (which we will call a perf.data.txt file). Significantly, as part of the conversion the symbolic names of all the frames of the stacks are resolved. The result is that this file looks like the following

That is it is series of events (samples) each sample has a process name (e.g. dnx) and a process and thread ID (e.g. 3407/3518) and timestamp (e.g. 30005552.151250). After this line is a list of stack frames followed by a blank line, and then you have the next sample. You can see that this very nicely fits into the model that a StackSource can represent so reading in this format as a StackSource is completely straightforward.
In version V1.9 of PerfView we added support in the GUI so that if a file ends in a .data.txt suffix, PerfView can then read this file and show it as a StackSource. Thus if you store your Linux perf data in a .data.txt file you can simply copy it to a windows machine and open it with PerfView can view it in the stack viewer and get something like this.

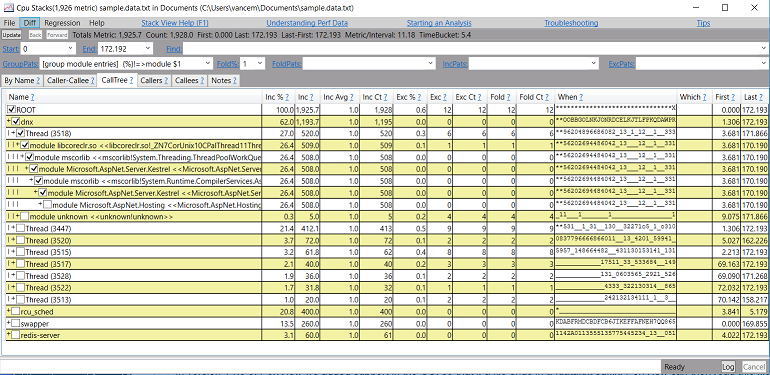
Ahh, that is much better!. I can now filter, group, and search and drill into and use all the other normal PerfView techniques on this Linux data.
.Trace.Zip Files
One major problem with the *.data.txt file is it is BIG. They tend to start at 100MB and go up from there. Clearly we would like to compress them. To support this PerfView created another extension called the *.trace.zip file. This is assumed to be performance data of some sort, and if it has a single .data.txt file within it PerfView can open that inner data. Thus in addition to being able to directly open *.data.txt files you can also open *.Trace.Zip files. To give you a flavor I have attached a file called GCBenchmark.Trace.ZIP file that you can download and open with PerfView to 'play around' with the feature. As its name suggests, this particular data file happens to be a Garbage collection benchmark It does a lot of allocation on many threads simultaneously but also tries to measure the any pause times, so it called 'Stopwatch.GetTimeStamp' a lot and this is what shows up on the traces.
Collecting Your Own Linux CPU Data
Obviously this capability of viewing Linux data is only useful if you can collect it on scenarios you care about. Well we have made that easy as well. We have created a BASH script called 'PerfCollect' that can do the following
- Install the Linux Perf support in the OS so you can collect the CPU data.
- Start and stop a collection as well as convert the resulting data to a *.Trace.Zip file that you can then transfer to Windows and open in PerfView.
The steps to do this are laid out in the PerfView help in Version 1.9 of PerfView. Simply select the Help -> Viewing Linux Data menu item to get the instructions to download the PerfCollect tool and use it go create *.Trace.ZIP files of CPU bound scenarios you have on your Linux machine.
Conclusion
In this entry I have shown you that PerfView's stack viewer is very flexible and we used this flexibility to allow it to read CPU profile information from a Linux Machine. There is clearly more to do here (the obvious next step is wall clock time investigations), so stay tuned for that. However the larger point to be made is that a very broad variety of data can be very useful viewed using PerfView's Stack Viewer. In fact my next several blog entries will follow up on that theme.