Update: Debugging Through the .NET Core Framework V2.0.3+ (Windows)
This blog shows you how to debug through the .NET Core source code using Visual Studio. There is a companion blog entry that indicates how to do it for Visual Studio Code (e.g. what you would use on Linux).
As you may or may not know, for a couple years in addition to running .NET code on the 'Desktop' runtime that ships with the Windows operating system, the .NET Runtime team also ships a version of the runtime called .NET Core which can be installed on various favors of Linux as well as Windows. In addition to being cross platform, it is also possible to ship your application 'with the runtime' which means that your app runs the same regardless of what version of Windows / Desktop .NET is on the target machine. See 'choosing between .NET Core and .NET Framework' for more on when to use .NET Core.
Visual Studio (currently 2017) is the suggested editor/debugger, for making .NET Core applications, and there is a free download for the Community Edition, so there reason not to use this excellent debugger/IDE.
One of the nice aspects of the .NET Core runtime is that it is open source. The source code for what ships in the runtime mostly lives in CoreCLR repo (for very fundamental things) CoreFX repo (generally the rest of System.*) or one of the ASP.NET repos (for *AspNet* dlls).
With all the source code available, it is possible to have a excellent debugging experience with framework code. Basically when you need source code from the framework it can be fetched by the debugger from GitHub and presented just like local source code. Visual Studio 2017 supports the SourceLink standard that enables this as of V2.0.3 of the .NET Runtime the team has published all the right symbolic information to the Microsoft public symbol server to make this experience 'just work'.
Stepping Into the .NET Framework
Cutting to the chase: if you are running on Windows, Have Visual Studio 2017 or later Installed, and have V2.0.3 ) (or later) of the .NET Core SDK installed (Shipped 12/15/2017). then you only need to do two things in Visual Studio to enable the experience of being able to step into the source code for the .NET Runtime (and ASP.NET)
- Uncheck the checkbox: Tools -> Options -> Debugging -> General -> Enable Just My Code. This tells Visual Studio that you WANT to look at framework code.
- Check the checkbox: Tools -> Options -> Debugging -> Symbols -> Microsoft Symbol Servers. This tells Visual Studio where to get the symbolic information for framework code.
That is it! you can now step into calls to framework code, or set breakpoints in framework methods and Visual Studio will automatically fetch the appropriate symbolic information and source code from GitHub and present it to you so you can step through it. Note that Visual Studio is pretty aggressive about downloading symbolic information so it can definitely slow down debugging (there will be a dialog box as it does its work), so you might want to turn off uncheck the use of 'Microsoft Symbol Servers' when you don't need it. Note that Visual Studio caches the symbolic information locally, so even after you no longer are probing the Microsoft Symbol Server, you still will be able to step into framework code, as long as the information has already been downloaded (likely if you are debugging the same scenario).
Pro Tip: Speeding up debugging by avoiding pointless symbol lookup.
Checking the 'Tools -> Options -> Debugging -> Symbols -> Microsoft Symbol Servers' checkbox in the instructions above has the disadvantage that whenever a DLL is loaded the debugger will see if there are symbols for it out on this server. If your network connection is less than great (e.g. congested WiFi), it can lead to slowdown and poor responsiveness in the debugger. But what is also true is that the debuggers caches all the symbols it finds in %TEMP%\SymbolCache. What this means is that after you have run your program ONCE in the debugger, it will have downloaded ALL the framework and ASP.NET symbol files loaded in that scenario to SymbolCache. That means that if you only want to look at framework DLLs from that scenario you can turn off the 'lookup on 'Microsoft Symbol Servers' and source debugging CONTINUES to WORK. This will work for all debugging sessions (since they all use %TEMP%\SymbolCache) as long as you don't need NEW DLLs or if you upgrade the framework DLLS. Note that even after you turn off the 'Microsoft Symbol Servers', source code lookup continues to work (even for new source code files), as long as the DLL that you are debugging has its PDB downloaded to the SymbolCache.
Disabling Framework Optimization (Seeing All Local Variables)
Enabling stepping is often enough (you can follow the flow of execution, however, because the framework code was precompiled as OPTIMIZED code, the debugger often will not have enough information to display local variables. Thus Visual Studio will show a 'Cannot obtain value' message in these cases. This can be frustrating if that variable was very important. By doing two more tweeks, you can solve this problem as well.
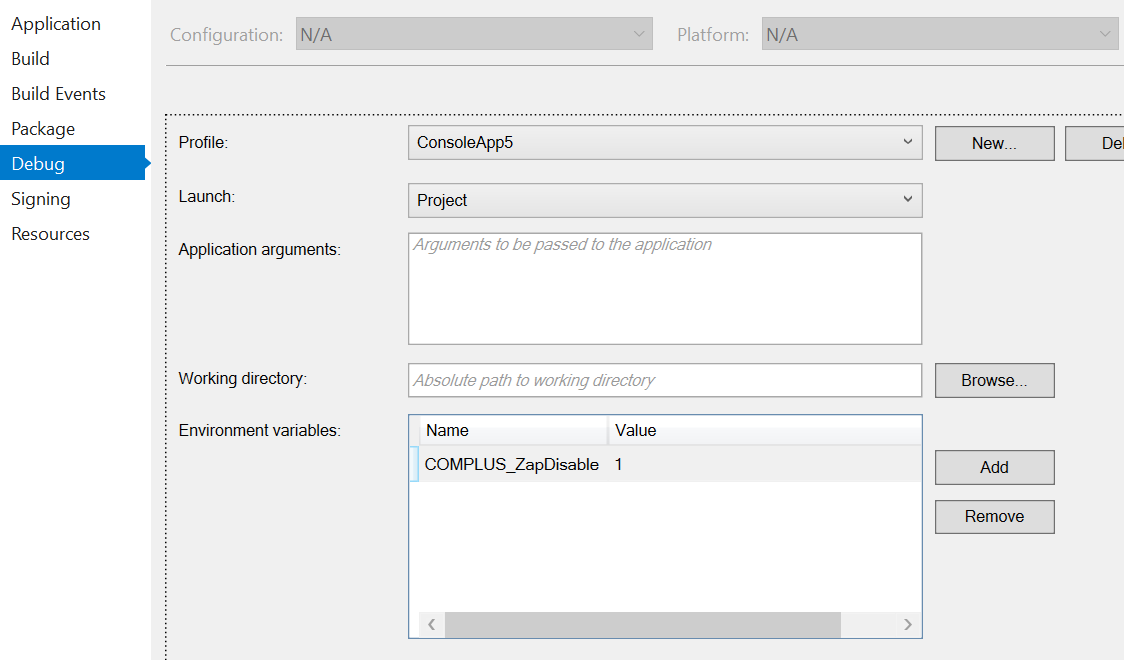
- Right click on the Project File in the solution explorer -> Properties -> Debug. Then press the 'Add' button in the 'Environment Variables', and add the environment variable 'COMPLUS_ZapDisable' with the value of 1. Be sure to type 'Ctrl-S' (save) after you make the edit because changes to the property page will NOT take effect by simply running the program, you have to explicitly save it. When you are done the property page should look like this.
- Check the checkbox: Tools -> Options -> Debugging -> General -> Suppress JIT optimization on module load.
The environment variable tells the runtime to disable the use of precompiled images (called 'Zap'ing). This forces the runtime to Just In Time compile framework code. By setting the 'Supress JIT optimization' the debugger then forces the runtime to not optimize this code, which allows the debugger to do a good job viewing local variables.
You know you succeeded when all the local variables that are in scope show up properly (by the way technically local variables are not in scope at the very entry of a method, you have to step once to be 'inside' the method where they are in scope). If you are not seeing this you can see use the Disassembly window (right click -> Goto Disassembly) to see if the code looks unoptimized (unoptimized will have many moves to and from the stack [rbp+X]). You can also see if the addresses of the code live inside the DLL you are currently in (Use the call stack to see what DLL you are currently in, and the Debug -> Windows -> Modules to see the limits of each DLL). If the code is outside the DLL than it is JIT compiled (which is what we want).
If you are like me and think that this should 'just work' please go and my Visual Studio Suggestion to fix this and vote for it.
More Information
So happy debugging through the framework! Here are some additional resources
- Dotnet Core Issue 897 - is a gitub issue that is the 'official' source of all the information presented here. It also talks about how to do this on V2.0 (earlier) version of the runtime. It is related to AspNet Issue 4155 which basically asked the same question about ASP.NET framework code. This later issue has a bunch of screenshots that can be useful if the terse instructions above are not enough.
Sadly, things are not quite so automatic if you are developing on Linux rather than Windows. Among other things Visual Studio does not run on Linux (but VSCode does). We are working on making this experience good as well and I hope to write a blog post about how to step through source on non-Windows platforms relatively soon.