What is using up all my Disk Space? Using PerfView for Directory Size Analysis
In my last blog entry, I talked about the fact that PerfView's stack view can be used on all sorts of data, and in particular can be used to read Linux CPU performance data. But I also pointed out that the stack viewer only needs data that is roughly hierarchical to be useful. Here we explore another set of data that can be usefully displayed using PerfView: Directory Size.
To Try it out is easy. Simply select the Size -> Directory Size menu item, which will bring up a dialog box to select a directory you wish to analyze. You can type '.' if you wish to analyze the current directory. You can also run this analysis from the command line by typing
- PerfView UserCommand DirectorySize DIRECTORY_TO_ANALYZE
When you do this PerfView will scan the given directory and create a StackSource where it follows the following rules
- Each File in the directory (or any sub-directory) is a 'sample' in the stack source
- The Metric associated with this sample is the size of the file in bytes
- The TimeStamp is the number of days between the current time and the time the file was last modified. (Thus 1 means the file was last modified 1 day ago).
- The stack is a list of 'frames' where each frame is the name of the directory from the starting directory to the file. It prefixes directory names with 'DIR' and the file Name with 'FILE' to make it clear.
- It also adds a 'pseudo-frame named 'EXT' which has the extension (the text after the . in the file name) before actually emitting the file name frame. This makes it easy to use PerfView's grouping to group together all files that share an extension.
Here is an example from my laptop
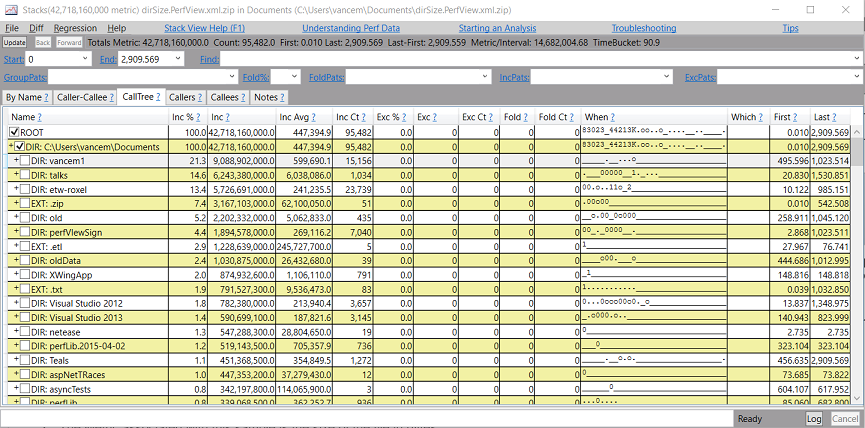
This is really nice. It quickly tells me the total size of my directory (42.7 Gig), and shows how it breaks down by directory. however I also get to see the ages of the files. You may not be able to see it in the image, but it shows that everything in the 'oldData' directory is at least 444.686 days old, so not much has been happening there.
But the real power is that you get to use all the power of PerfView to look at this data. Want to exclude certain files from consideration, easy? Want to group by a particular directory or extension: easy! Want to look at only old files, easy!.
Finally it should be noted that when PerfView created this data (the StackSource) it saved the data in a *.PerfView.xml.zip' file (you can see the name of this file in the title bar of the stack viewer window). Thus you have a persisted copy of this data. This is useful for two reasons
- You can reopen this data days later very quickly (you don't have to rescan the disk)
- The file acts as a snapshot. Thus you can take another one later on after some time has passed and use PerfView's 'Diff' capability to see just exactly where the new files were created (although the 'When' column can also tell you that to a coarse degree).
Once you have done disk size with PerfView, you never want to go back.
Happy disk cleanup!
Vance