Using PerfView on 'External' data (e.g. Other Profilers)
Executive Summary
If you want to emit JSON or XML data that PerfView can simply view in the stack viewer, see the Help -> Viewing External Data menu entry.
Details
In my blog on using PerfView with Linux I noted that it is relatively easy to make PerfView consume other sources of stack-like performance data. In my blog entry on Directory Size we saw that files size data fit this general format and can also be usefully be viewed in PerfView. In this blog entry we look at the general case of how to 'bridge the gap' between any stack-like data source and PerfView.
What Kind of Data Are we Talking About?
Before we get into the details, lets motivate why it is interesting. Here are some things off the top of my head
- You wish to interpret Linux data (e.g. you want blocked time), but you don't want to wait until the next version of PerfView
- You liked the 'Directory Size' feature, but you want it to work on Linux, or on Cloud storage.
- You already collect a bunch of data in your data-center with events and want to experiment with using PerfView's grouping/folding/filtering operators.
- You have data collected by existing profiler, and wish to experiment to determine if PerfView's views are superior
- You collected data with a debugger (e.g. single stepping or with automated breakpoints), and need a viewer for it.
- You use some runtime (e.g. go, javaScript etc) which gives profile data, but want to used PerfView's views to analyze it.
In short there are lots of reasons.
Two Approaches
There are basically two very different approaches to bridging foreign data to PerfView.
- You can make PerfView understand some format that the source of the information already knows how to emit. (this is what we did for Linux data)
- You can make the data source emit the data in a form that PerfView understands.
It turns out that both of these are not that hard, and can be useful depending on the circumstances. In future blogs I will talk about how PerfView allows you to extend it (see Help -> Extending PerfView if you can't wait) which lets you do option (1), however in this blog I want to talk about the case where we make a converter that makes it easy to just read with PerfView.
PerfView StackSource JSON and XML Formats
PerfView defines two very simple formats for specifying data to display in a Stack Viewer. One is XML based and the other JSON based. Both are 'basically the same' and are intended to be a 'boring' specification of that data needed. Here we are only going to show the JSON case. The XML version is very similar.
The format is best shown with an example. Lets assume we create a file called 'sample.perfView.json' with the following data
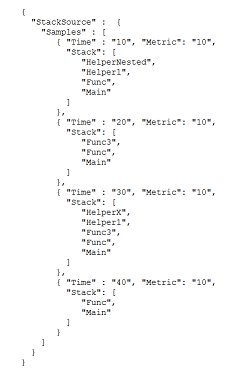 Hopefully this JSON is self-explanatory the file represents a StackSource, which has a Samples' property which is an array of objects. Each object has a 'Time' (which is an optional decimal number) a 'Metric' (which is also a optional decimal number) and a 'Stack' which is an array of strings (from the most specific to the least specific). If you open this file in PerfView you will see the following.
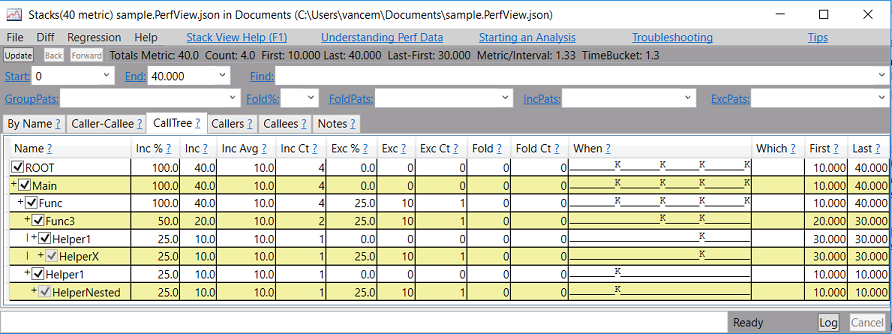
Which hopefully makes perfect sense to you. The metric become the metric you see in the view and the time becomes the 'When' and 'First' and 'Last' columns. PerfView then rolls all of the stacks into a tree and computes the inclusive metrics.
I have attached a sample.PerfView.json file to this blog entry if you wish to start with something to experiment with.
Thus the strategy is very simple: simply make your tool emit JSON in the format above and name the file with a .PerfView.json extension and PerfView can open it. PerfView also understands a format where a .PerfView.json file is put into a ZIP archive and named with the .PerfView.json.zip this makes the file much smaller in most cases (e.g. 1/10 the size).
More Optimization
The format described above is very simple, but it is also pretty inefficient. The stacks tend to be repeated many times and/or have the same 'tail' (path back to thread start). While Zipping helps, Zipping does not help in the processing (you still need to uncompress and scan all the redundant stacks when reading (or producing) the data. We could avoid this by assigning a numeric ID to every distinct name (Frame) and every distinct stack (which is simply a tuple consisting of a frame ID and a 'Caller' stack ID). Thus the file format would change to be a list of frame ID definitions, followed by a list of stack ID definitions followed by the list of Samples, where the Stack IDs are used to reference the stack. This in in fact the format that PerfView SAVES stack views. Thus the easiest way to see examples of this format is to use the 'File -> Save' option on the stack viewer to save a stack view. This creates a .PerfView.xml.zip file. Then unzip the file and you can see the format of the file. Currently this format is only supported on the XML format, but that could be changed rapidly if there is any desire for it in the JSON case.
Conclusion
So there you have it. In this blog we learned that PerfView has defined a *.PerfView.json file format that makes it easy for external tools to define their data in a way that PerfView can 'just read'. This opens up PerfView to be the viewer for just about any hierarchical data.