Histograms with PerfView (Ad-hoc Data Analysis).
In my blog on external profile data in PerfView as well as my blog on disk space analysis and Linux investigations I showed that PerfView can be used for almost any data analysis that involves hierarchical data (which covers a lot of ground). In this blog entry I will show you that PerfView's stack viewer can be useful for displaying even non-hierarchical data in useful and meaningful ways.
While I motivate the histogram functionality with the problem of determining the usage characteristics of .NET IL instructions, it is important to realize that the need for histograms is pretty common. Any time you have a large set of things and want to cluster it into groups to gain insights you probably need histograms. For example
- you might have a set of error messages that you have gleaned from your logging infrastructure and would like to know the most common errors.
- You might have routing information from your cloud infrastructure and you would like to understand what routes are 'hot'.
- You might have sales information on what customers purchased, and you would like to do analysis about what things are purchased together.
In short, this problem crops up quite a bit. Now on the surface using the stack viewer to view such information seems like a poor fit because this data is not obviously hierarchical. However the insight that I had was that even without a hierarchical structure PerfViews Stack view provided a lot of value because of its ability to rename, group, filter and drill into.
An example will make this clearer. Consider the following problem: In .NET code is expressed in a special 'Intermediate Language (IL) that a virtual machine 'runs' and we ask questions like
- Which instruction is the most common?
- For any particular instruction, how often are particular arguments used?
For this we needed a histogram (a graph whose X axis is arbitrary (in this case IL instructions), but whose Y axis was frequency (counts)). It was relatively easy to 'dump' a particular DLL to get a set of lines that showed every instruction that is in a particular DLL. I have attached sample data to the end of this blog (instructions.txt), but here is a very small sample of what is in the file:
ldarg.0
call instance void [mscorlib]System.Object::.ctor()
ldarg.0
ldc.i4 0x927c0
stfld int32 CommandOptions::timeoutMSec
ret
ldarg.0
call instance object [mscorlib]System.Object::MemberwiseClone()
castclass CommandOptions
ret
ldarg.0
ldfld bool CommandOptions::noThrow
Each line represents one instruction that was in the DLL along with its arguments. To digest this data we will use what is called a PerfView User Command. A user command is basically a command that could be defined 'outside' PerfView. Thus you can make your own user commands if you wish (see Help -> Extending PerfView). PerfView comes with some 'built-in' user commands. These are commands that are specialized enough that they don't deserve 'top billing' but are useful enough that you may want learn about them after you have learned the basics of PerfView. In this case we will be using the 'TextHistogram' user command. We can run at the command line by typing
- PerfView UserCommand TextHistogram instructions.txt
But we can also run user commands by selecting the File -> UserCommand menu item and typing the command. You can learn more about all the user commands that exist and the help for each by either using the Help -> User Commands menu entry or by clicking the 'Command Help' button when you use the File -> UserCommand menu item.
Running the TextHistogram user command on the 'instructions.txt file produces the following stack viewer.
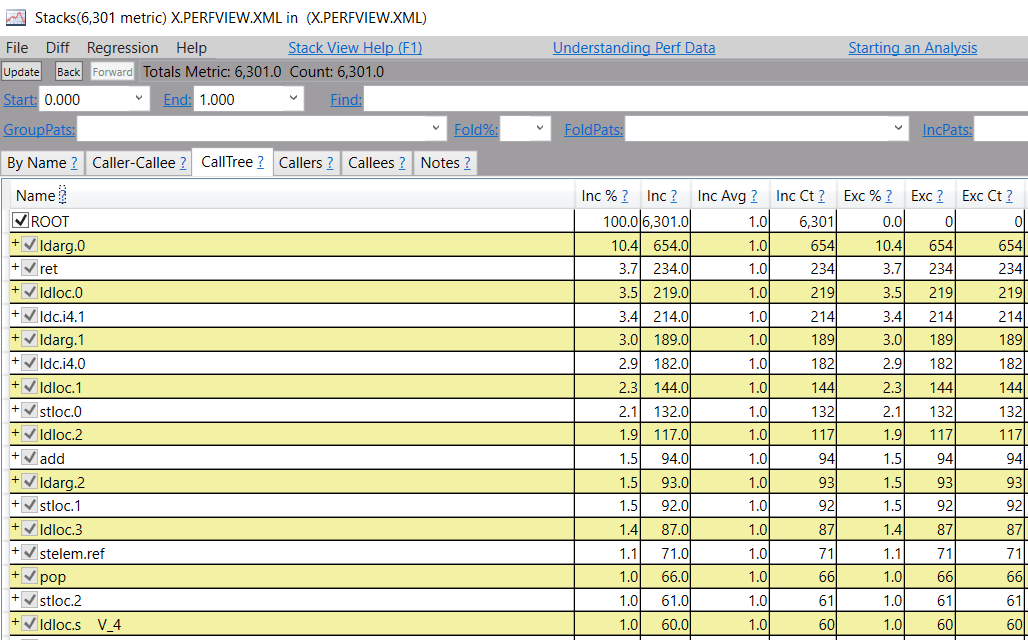
As you can see, what it does is read in each line in the file with a metric of 1, and a stack of one element (whose frame is the line in the file). Thus all stacks are 'trivial' one element stacks.
Still you can see that PerfView adds value because it has grouped each line in the file that was identical together. Thus we see that there were 6301 lines in the file, and of these 654 or 10.4% of the total were ldarg.0 instructions.
Not bad, but the real value of PerfView's view you can do easy grouping. In this case each line represents an instruction AND ALL ITS ARGUMENTS. Thus instructions like 'call' are unlikely to group with anything because the call target has to match as well. What if we just wanted the histogram of instructions IGNORING their arguments. You can easily do this with PerfView's grouping.
The GroupPats dialog box is a list of specifications of the form PAT->REPLACEMENT that allows you to search and substitute names in the viewer. (see the blue 'Group Pats' hyperlink for details). By default the 'PAT' in this specification is a 'simplified regular expression but if you prefix the pattern with an @ you can use the normal .NET regular expression syntax. By using the pattern
- @^([a-zA-Z]+)->INSTR $1
It is saying match (and form a regular expression group) for the first alphabetic letters that start the line and transform the line into INSTR $1 where $1 is the group that was matched. The result is that you strip off all but the first word of the line. The result is the following
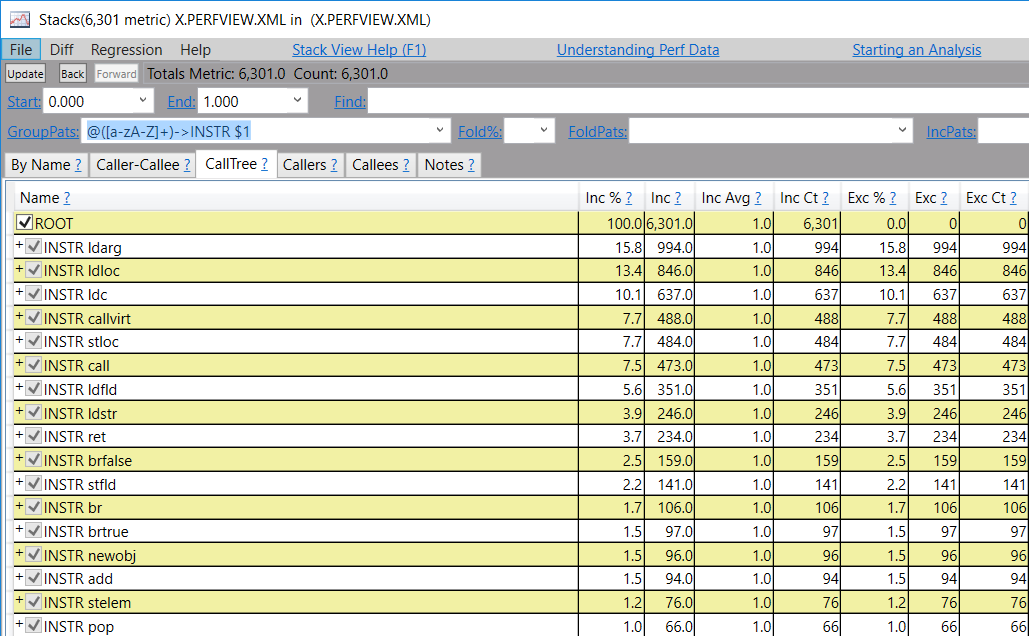
Which is exactly what we want. We now know that the ldarg instruction is the most common representing 15.8% of all instructions, followed by the ldloc and ldc instructions. This is pretty cool, and basically only took minutes to compute (that is the best part).
But it gets better. It turns out that ldarg takes a parameter (the argument number) and we would like to know the frequency of each of the values of that argument. This can be done in a number of ways, but of the most 'obvious' ways is to use the 'drill into' feature. To do this you can select the cell that represents a set of interesting samples, in this case the sell with the 994 in it that represents all the samples that are ldarg. If you then right click -> Drill Into, it will open a new stack window on JUST THOSE SAMPLES.
You can then clear the grouping pattern, which allows you to see the full instruction again (and thus see the finer groupings)
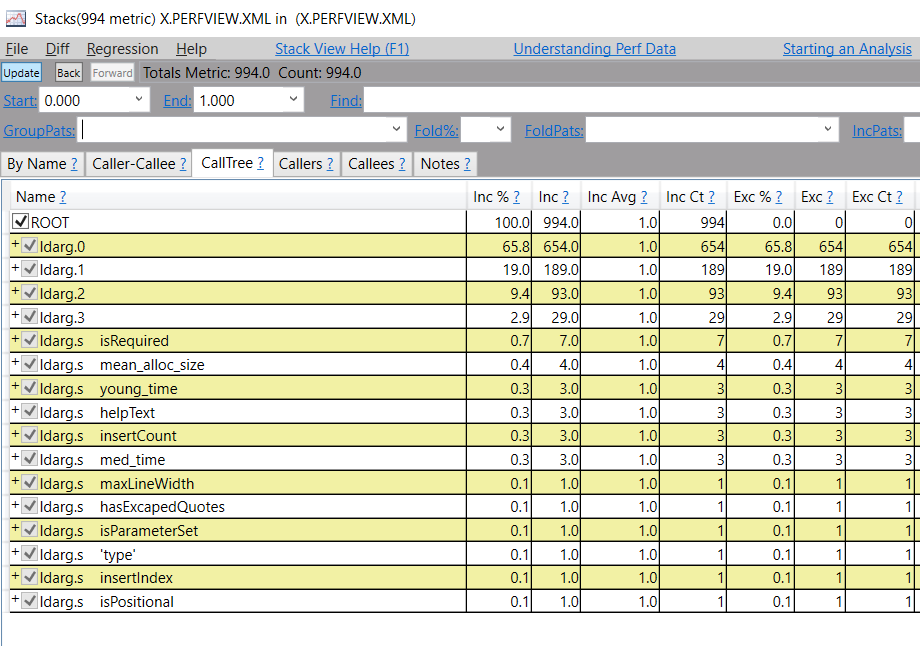
This is pretty good, but not exactly what we want because the ldarg.s instruction has the name of the argument as its parameter and that is inhibiting those from being grouped. That is easily fixed with the following grouping pattern
- ldarg.s->ldarg.s
Which takes any line that CONTAINS ldarg.s and replaces it with ldarg.s, thus stripping out the argument
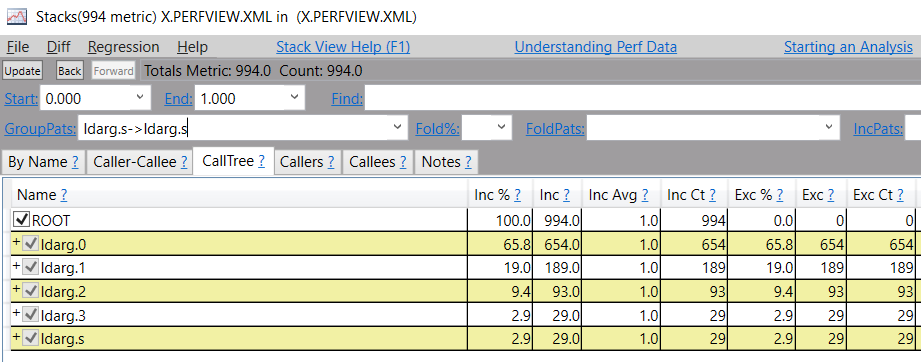
Which is the histogram of the various favors of ldarg that we wanted. Thus we see that 65.8% of all ldarg instructions are ldarg.0 and 2.9% of the instructions use the ldarg.s instruction.
The Tip Of the Iceberg
In this blog we learned that PerfView can be used to form histograms of pretty much arbitrary text data. The grouping, filtering and drilling into functionality is useful even for this non-hierarchical data. It does not take too much imagination to realize that this is jus the tip of the iceberg. We have not event metnioned (yet) that you can also use PerfView's diffing functionality. Finally if you had tabular (e.g. CSV) data, it would not be hard to use the techniques from the blog on external profile data to use that data to set the metric or the time, or (more powerfully), make each entry have not the trivial stacks shown here but a list of frames representing the other data in the table associated with that row.
In short, if you want to manipulate the data of almost ANY FORM, there is a REALLY good chance that representing it in the Stack Viewer will give you a set of powerful operators to form queries over it.
That has been my experience anyway....
Vance