Using TraceSource to log ETW data to a file
Yesterday's blog post was showing how you can use EventSource to generate ETW events and the TraceEvent library to read them in 'real time'.
Today we will do a slight variation on that example. Instead of reading the events in real time, we will simply log them to a file, and then later (it happens to be right after the file was generated), we open this file and process it. As you would hope the actual difference in the code is pretty minimal. This example also cleanly separates 'generation' of data from 'processing of data', which is nice.
Generating the file
At it's heart, this is the code to generate the file is pretty simple.
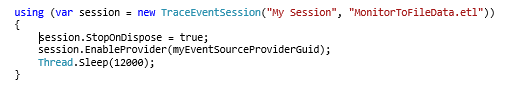
This code creates a TraceEventSession, giving it a name, and in this case a file name to log the data to. Next we tell the session that the OS session should be stopped (reclaimed) when the TraceEventSession is disposed. We then enable any providers we want to log (in this case only one), and then collect for 12 seconds and then close the TraceEventSession (the using statement) which closes the file. At this point we have our data.
Processing the file
To process the file we use the following code.
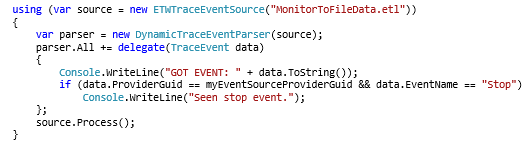
This code opens the data file, hooks up the DynamicTraceEventParser (which knows how to parse EventSource providers, and register a callback for ANY event that the parser recognizes (the All event). In this callback we print out the event and also print something special when we see the 'Stop' event.
After setting up the callbacks we call 'Process' that reads the file and does all the necessary callbacks. It returns when there are no more events in the file to process.
And that is about it. As you can see it probably EASIER to do ETW data collection in two pieces (they split very nicely into two pieces). The first piece ONLY deals with TraceEventSession (the controller), and the latter piece ONLY deals with ETWTraceEventSource and parsers (the READER). Each one is pretty easy to understand.
Check out the complete sources
The MonitorToFile.zip has the complete, buildable source code (uses a VS 2010 or VS2012 solution). The code is a bit longer because it has a lot of comments and a bit of error handling, but I hope you will be able to easily recognize the snippets above as the 'heart' of the program.
Advanced scenarios: Circular buffers and Kernel events.
Once you understand the basics, you may be interested in some of the more advanced features. In particular there is the ability to log to a 'circular' file, where the file size is constrained to a maximum and when the maximum is reached it starts overwriting the oldest data in the file. This allows you to create a 'flight recorder' and allows you see the last few minutes of processing before an interesting event happened. Setting up a 'trigger' that will stop such a circular buffer logging session is a pretty common scenario. But the loss of the events in the beginning of the trace brings problem, the most serious of these is that the decoding of some events requires information from other events. In particular EventSources themselves generate a 'manifest' event when they start that describes the fields of every other event the EventSource will generate. If this event is lost, then libraries like TraceEvent.dll can't decode the payloads of the events (a HUGE loss). To fix this, when you collect a circular trace, right before you stop the trace you need to force any EventSource that you started to emit is manifest event again. This way you make up for the loss this event that happened earlier in the trace but was discarded by the circular buffering. It is reasonably straightforward, but does complicate the code a bit.
We have seen that it is pretty easy to log EventSource data. The same is true for .NET events as well as some OS events. However some of the most important events (the Kernel OS events) have additional restrictions on them, and one of these restrictions is that kernel events can only be logged in a session by itself. Thus if you want both EventSource data as well as Kernel OS data, collecting the data is more complex. If there is interest I will talk about this scenario, but you can also look at the PerfMonitor source code right now to see how it is done. This is particularly tricky for real time sessions because different buffer flushing protocols will make the events come from the two sessions in clumps that are only loosely related to the time the event happened. Thus it is a bit trickier to properly sort the events from the two sources. The PerfMonitor code has a special class specifically to solve this problem.