Video: Wall clock time analysis of ASP.NET Applications using PerfView
ASP.NET applications are one of the more common uses of .NET code today, and the PerfView tool has some special support for profiling them. I created the video 'Wall Clock Analysis of ASP.NET Applications' as part of the PerfView tutorial video series. You can learn more about wall clock time analysis in general (and find useful videos) by reading my previous blog post.
In this video I take a hello-world ASP.NET application and modify it to consume both CPU time (by spinning setting a property a lot), and blocked time (by calling Sleep), the code is basically
for(int j = 0; j < 100; j++)
{
System.Threading.Thread.Sleep(1);
for(int i = 0; i < 2000; i++)
HelloWorldLabel.Text = "Hello, world! The time is " + DateTime.Now;
}
The point is not to have an interesting application, but to show how PerfView can help you find hotspots of both CPU and blocked time (in this case Sleep, but it could have been a database call).
The key to this is the 'Asp.NET Thread time view'. The main problem with doing ANY wall clock time analysis is to separate interesting time (that is time on the critical path between receiving a request and sending a response), from uninteresting time (time threads spend waiting for the next request). This is what the ASP.NET Thread time view does. It finds the region of any thread associated with a particular request and groups it under a 'pseudo frame' for that request. The requests are further grouped by URL. The result looks something like this
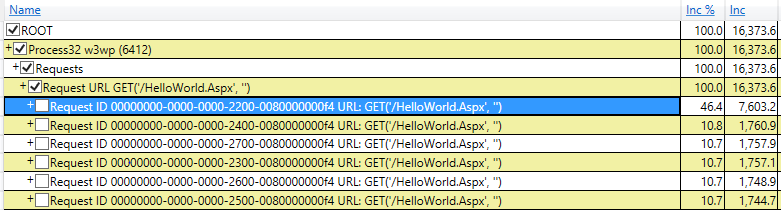
Which is very understandable. It shows that there were 6 requests, all but one of which took 1.7seconds of time (and the highlighted one took 7.6 seconds) and that they were all responding to the URL 'HelloWorld.aspx'. Thus the view nicely finds the important part of the execution (that related to the processing of a particular request), and groups them together. You can then filter (look at only one request, or one URL, or whatever), and look at where the time went (opening the subnodes into a particular request).
The main point is that by doing this relatively simple transformation (grouping resource consumption (time) by the request that 'caused' it) we make doing the analysis very straightforward.
So if you have an ASP.NET application you would like to optimized, take a look at the video, then download the attachment below and walk through it yourself. To use the attachment, simply open the ZIP file, and then drag the folder inside it to your desktop or other location. The ASPX file is the source code (open it in notepad), and the .ETL.ZIP file is the PerfView data file (you don't need to unzip it, just open it with PerfView).