Publication of the PerfView performance analysis tool!
I know it is has been a while since my last posting, but long ago I decided that I would not write just to have something to write about but rather only when I had something I really something useful to say.
Well do have something really useful to say. For a long time I have wanted to give very specific advice about how to do various performance investigations, however, it was hard to do so as the only public tools Microsoft had for CPU investigation we had were Visual Studio's profiler (which until recently was available on for relatively expensive versions of Visual Studio), or XPERF (which did not have support for decoding symbolic information for managed code). For memory investigations we had CLRProfiler tool, however that tool had scaling problems (it really could not handle GB sized heaps which have become common), and I always found the node-arc visualization of the data to hard to use effectively.
Well, that all has changed. After months of work to get it published, I am happy to announce that a VERY useful performance tool called PerfView is now available at the Microsoft downloads center. You can download this tool for free at the PerfView Download site right now. I do alot of performance investigation on a daily basis, and this is the single most useful tool I have to do my job, do recommend you give it a spin.
To get started
- Goto the PerfView download site https://www.microsoft.com/download/en/details.aspx?id=28567 (if this does not work, go to the Microsoft download center and search for PerfView)
- Click the Download button (the download is a ZIP file), and open the ZIP file.
- Inside you will find the PerfView.exe file. You can simply double click on it to run it, or you can open some other local directory on your machine and copy it (drag an drop) there.
- You are then up and running. After OKing the EULA, you should get something that looks like this.
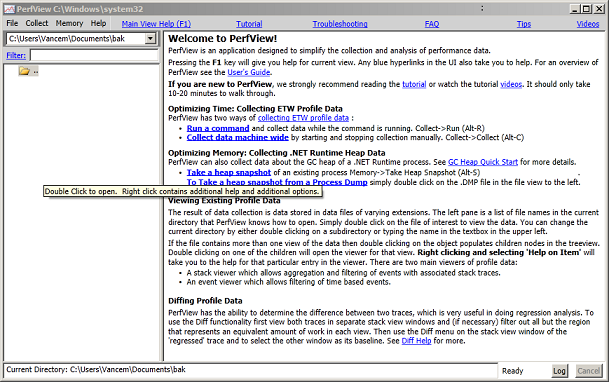
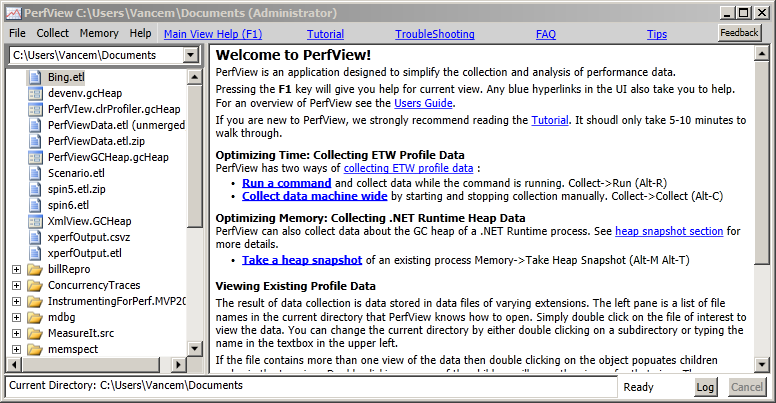
To give it a spin, simply click on the 'Tutorial' link on the main page (either at the top or in the 3rd paragraph in the body), and minutes later you are doing your first PerfView performance analysis.
Notable features of PerfView:
- Good help. We went to some trouble to put a lot of 'just in time' information into the tool. You can see even from the screenshot above there are a bunch of blue hyperlinks scattered in the UI. Each of these take you the relevant part of the user’s guide, and the user's guide is even more packed with hyperlinks to related information (there is also full text search). There are even videos of PerfView in use, however we are still in the process of getting these published externally, so for now you can use the videos (I will post soon when that works). Please take a look at the links at the top of the views, as they give you important 'perf theory' that you REALLY do need to understand to insure that don't misinterpret the data you collect.
- Super easy deployment. Simply copy the single EXE and run. It will work on any Vista+ Windows OS (Win2k8, Win7). This makes it easy to put PerfView on a USB drive or a network share, and take it wherever you need to to collect the data. It really can't get easier.
- Support for both CPU and Memory Investigations. PerfView is based on the same technology as the XPERF/WPR tool called ETW. In fact data generated by one two can be viewed in the other, so if you like XPERF you are more than welcome to use whichever tool you prefer. However for managed code expecially PerfView has some advantages. In particular PerfView allows you to take snapshots of the GC heap (even 50GB heaps), without interrupting the process (great for servers), to understand the memory performance of your application.
- Excellent grouping facilities. After you have investigated your 'trivial' performance problems (were 50%+ of your time is spent in a small amount of code), your profiles quickly become 'flat' and it is harder to find additional optimization opportunities. One reason it is hard is because your performance cost is 'scattered' among hundreds (or thousands), of 'helper' functions operating system routines, so that it is hard to find 'big' chunks of lost perf. The solution to this is to group functions together into logical groups (that perform some recognizable semantic action), so that you can highlight how much each semantic action is costing you. PerfView has the best facilities for doing this that I have ever seen in any performance tool, and it is the main reason why I use this tool over any other (once you have grouping, you can never go back to a tool without it).
- Drilling into feature. Performance investigations typically have two phases. In the first phase you are interested in grouping costs until you have a small number (< 10) of semantically relevant nodes that account for a majority of your cost. Once you have done this, you want to investigate each of these (now known to be very relevant), nodes in turn. PerfView has a feature called 'Drill Into' that lets you do just this. It allows you to identify a set of samples (a cost), and open a new viewer for JUST THOSE SAMPLES), which can then be grouped and filtered in new ways (typically removing some of the grouping to reveal one deeper level of abstraction), so you can understand that cost (and just that cost), in more detail. Super useful.
- Diffing. Tracking down regressions is a common operation for performance professionals, and so the ability to do a diff of two traces is an important feature. However, PerfView’s grouping features are even more valuable here, because when you compare two runs there are typically 'expected' differences (after all the builds did change), and you need a way of 'ignoring' differences that you understand, and don't care about. PerfView's grouping and drilling into features give you powerful ways of ignoring differences you don't care about and highlighting those you do care about. Again, no other tool I have ever used comes close to doing the job that PerfView does.
Now that the PerfView tool is public, you can expect to hear a lot more from me from my blog, as I expound more on performance best practices (now that there is no excuse for getting some data!).
So what you are waiting for? You should be downloading PerfView....
Vance
P.S: The goal of this (and subsequent) articles is to get people doing sucessful performance analsysis. You can use PerfView for this, but there are other good tools as well. In particular, the WPR.exe tool (the new tool by the XPERF team), released as part of the windows 8 //build conference, also handles symbolic information associated with managed code (e.g. you get stack traces with method names). You are also more then welcome to use this tool to do managed code analysis (and as mentioned, the data from WPR and PerfView is interchangable). See the Windows Performance Analsysis Center for more on that tool.