Automatic CRM Network Diagnostics with USD
Troubleshooting networking issues can be challenging particularly when dealing with intermittent issues. With the transition to CRM Online and other SAAS services, having a performant network and Internet connection becomes even more important. There are some great tools out there for diagnosing network issues including ThousandEyes, Netmon, and others. Generally these tools will give you great insight into network to network connectivity but they become challenging if you are experiencing network slowdowns in a remote site, remote user, or a specific group of users. To deal with these, you can install an application on their computer to monitor network traffic but that can be a painful process as well. Fortunately Dynamics CRM provides a special web page used to provide network statistics from an individual users machine to the CRM server.
Dynamics CRM Diagnostics Page
To access the diagnostics page of CRM, visit the following URL, substituting your hostname into the appropriate spot in the URL.
https://[My CRM Server]/tools/diagnostics/diag.aspx
After clicking the Run button, you'll get information like the following.
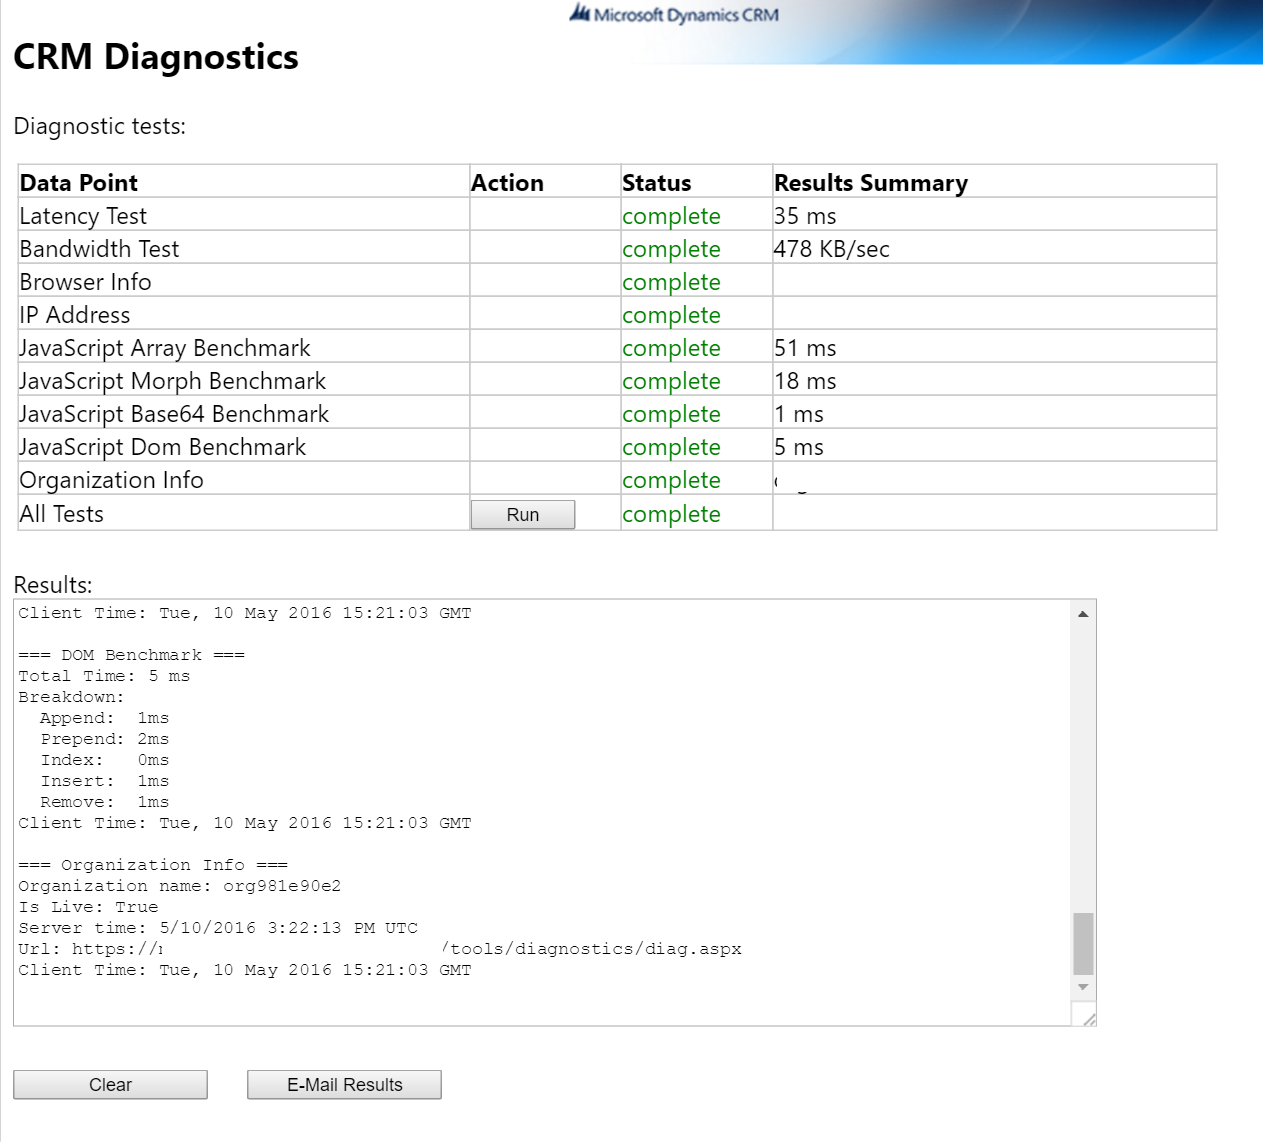
This diagnostics page has information such as Latency to and from the server from the machine that you opened this page, as well as bandwidth information, and some useful statistics affecting javascript rendering of elements within the web page.
While this page is great if you are an admin and understand the data, what if you are troubleshooting a users machine and connectivity that is not as computer literate? What about your call center agents that may struggle with getting you the information you need to help them with their networking diagnostics?
If the users utilize USD, there is a solution for you as an administrator that allows you to capture this diagnostics information for individual users of your choice on a periodic basis.
Bringing it into USD
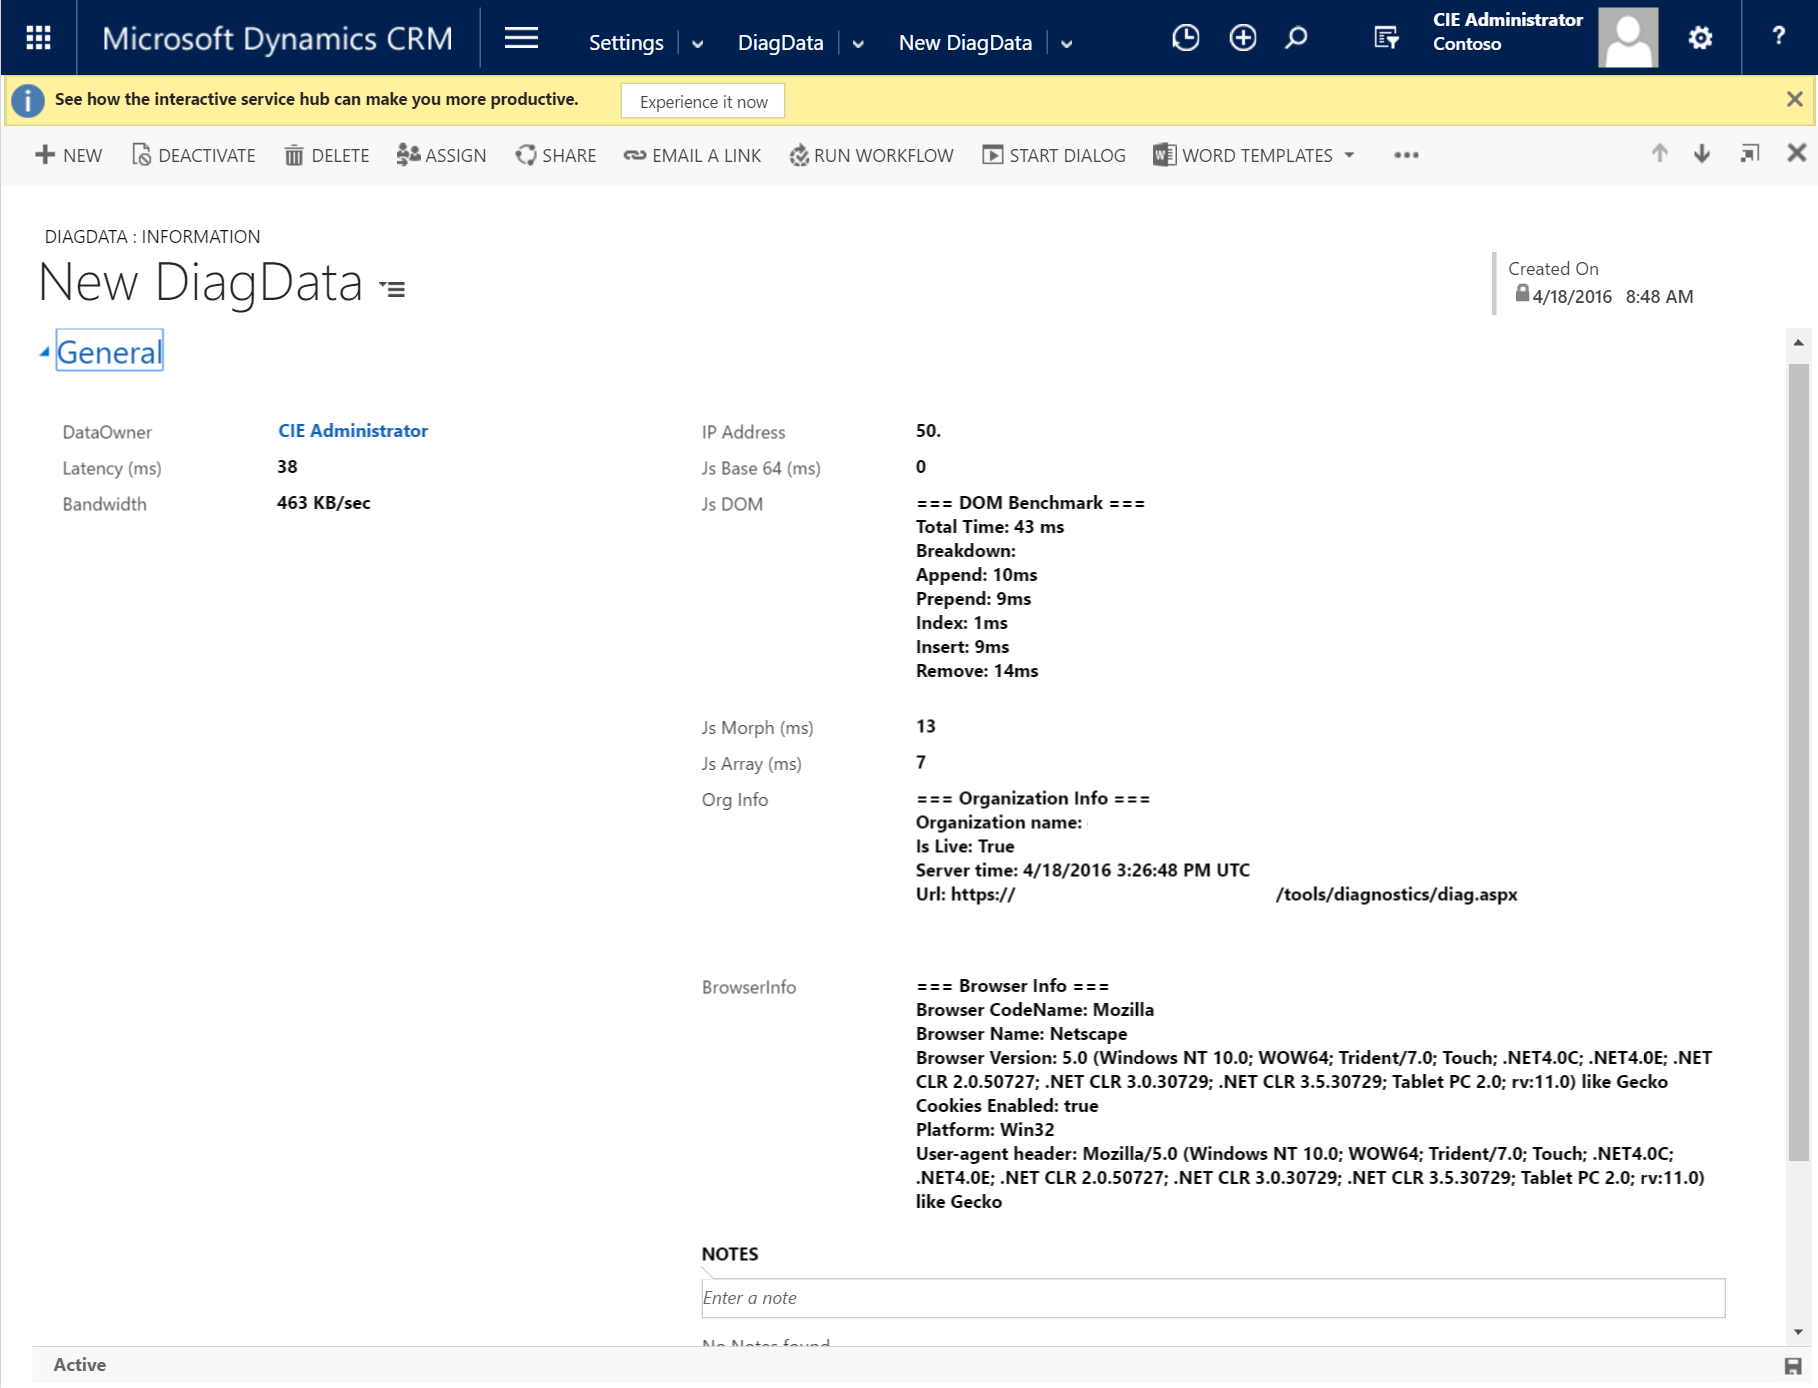
In this blog, I plan to demonstrate how you can, without user intervention, capture the information from CRM Diagnostics on a periodic basis for a user, and have it uploaded to an entity in CRM for administrative review and trending. Because it is CRM data, you can also do reporting off the data, if you wish. Here is a screenshot of a record containing the output that you can achieve with this solution.
For simplicity sake, I have uploaded the files that you need to get started. To start with add the following solution to your CRM Solutions area:
Managed Version: Diagnostics_1_0_0_0_managed
Unmanaged Version: Diagnostics_1_0_0_0
NOTE: You will want to go into the solution view and add the DiagData entity to your sitemap. I intentionally left the edited sitemap out of this solution. I typically add it to the Settings area. You may alternatively access the data via the Advanced Find, if you choose.
Next, you'll want to download the CRM SDK if you don't already have it. In the tools folder of the SDK, there is a tool called the Configuration Migration Tool. Run that and select import. Login to your CRM instance, and when prompted for the import file, select the following file:
This will import the appropriate CRM entries to make the solution work. I will discuss the entries in more detail later.
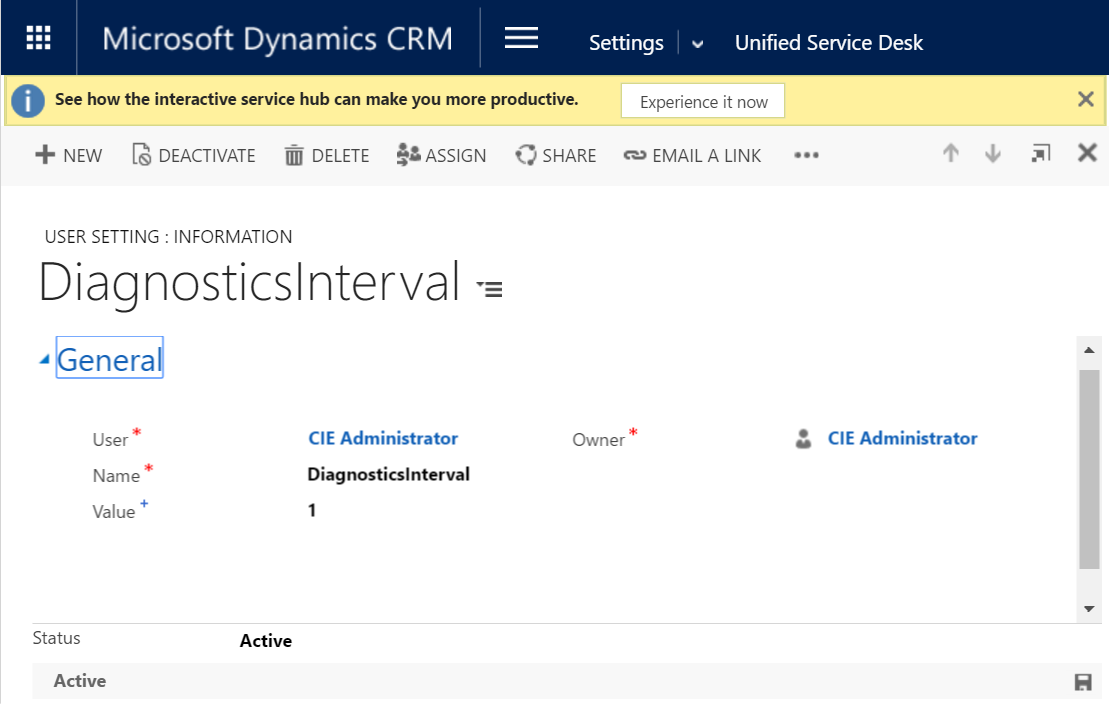
When the user starts up USD, it will begin looking for the admin to activate the feature. This is done by adding an entry to the User Settings area of USD. You active the diagnostics by adding an entry titled, "DiagnosticsInterval" and supplying a value containing the number of minutes between each rerun of the application.
NOTE: Do not put 0 for the Value. I do not protect against someone putting 0, which would make it run repeatedly until turned off. This would most certainly affect your machine performance.
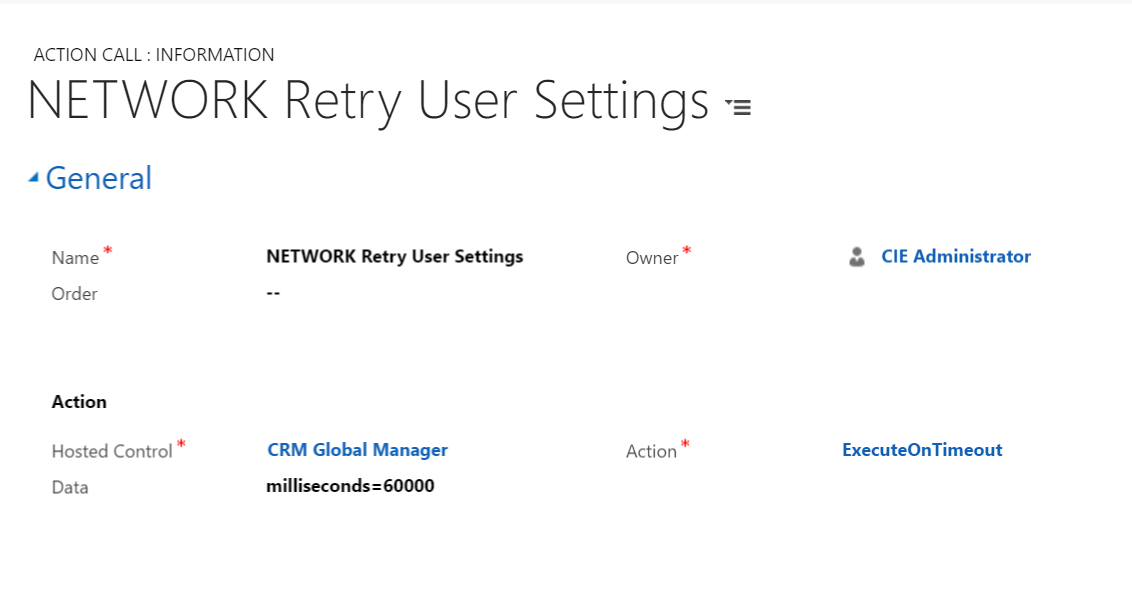
Once activated like this, and the record is saved, you must wait for the application to recognize that the setting exists. This interval is controlled by the Action Call, "NETWORK Retry User Settings". As you can see here, mine is set to retry every 60 seconds. Make sure you set this to a reasonable value for your needs. The application will run a query for user settings every time this interval expires so if you have a large number of users, you will want to consider a longer interval to avoid impacting the network with these queries. On the other hand, if you set it for a long interval, then after you set your DiagnosticsInterval above, you may have to wait longer before you start seeing data from this user.
Once USD picks up the user settings, it can start looping on the DiagnosticsInterval. In my example above, USD will run the diagnostics every minute, capture the data, and write a CRM record containing the data. Generally a less frequent interval for this activity is fine but you can set it depending on your needs.
How it works
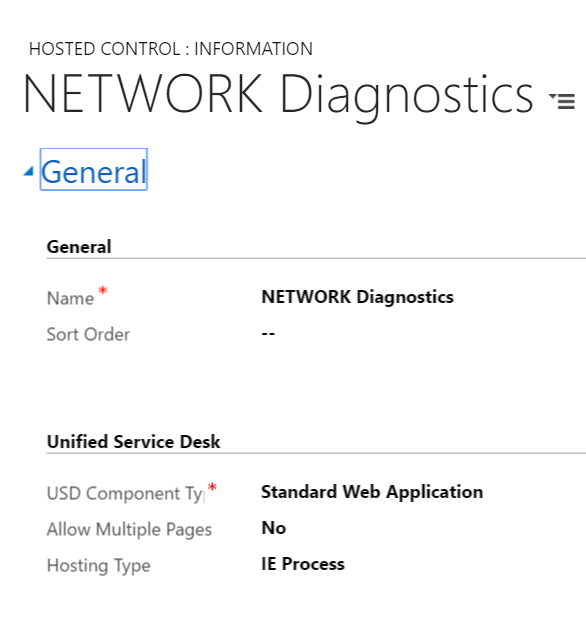
There is an all important hosted control that was created called, "NETWORK Diagnostics". This hosted control is a standard web application. Notice the hosting type is set to IE Process.
VERY IMPORTANT: Because this tool relies on utilizing the same session as the users' login to CRM, it is very important that the hosting type be set to the same value as you use for your CRM Pages within USD, otherwise the login will always fail.
In my case, I use IE Process for my CRM Page hosted controls so, I will use IE Process for my NETWORK Diagnostics hosted control setting.
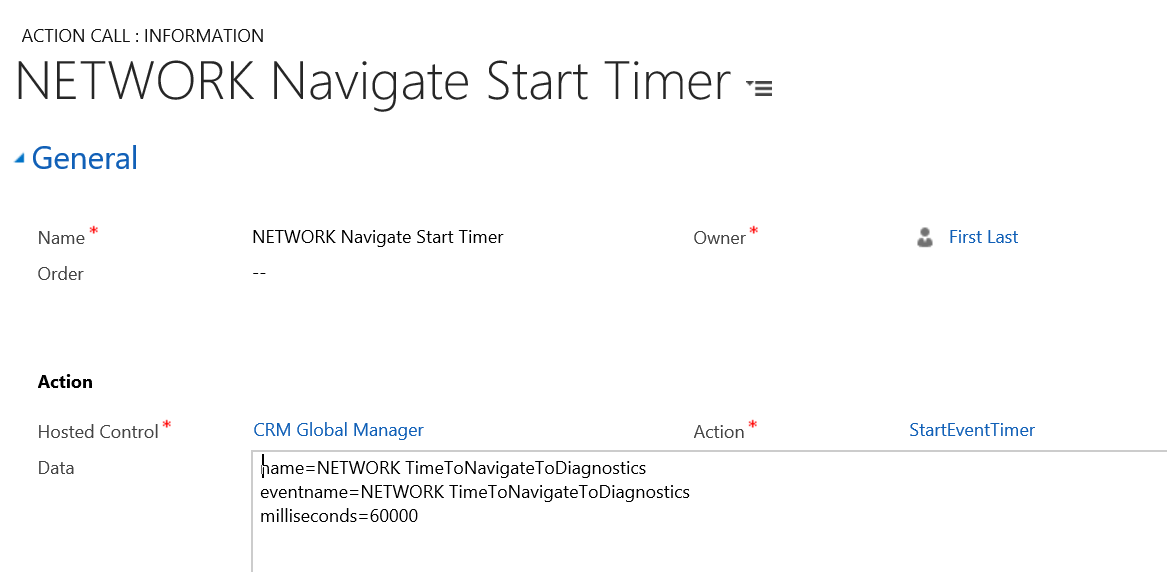
Within your DesktopReady event for your Global Manager hosted control, USD will kick off the attempt to load the diagnostics page of CRM. It does this with by calling global managers StartEventTimer action, initially waiting 60 seconds before attempting to connect to the diagnostics page. This action will continuously fire the "NETWORK TimeToNavigateToDiagnostics" event at a 60 second interval. The reason we don't try immediately is to allow the user time to authenticate properly to the CRM web pages and establish the authenticated session. If the user takes longer than this, that is ok, the application will try again later.
After the 60 seconds has expired, the "NETWORK TimeToNavigateToDiagnostics" event is fired.
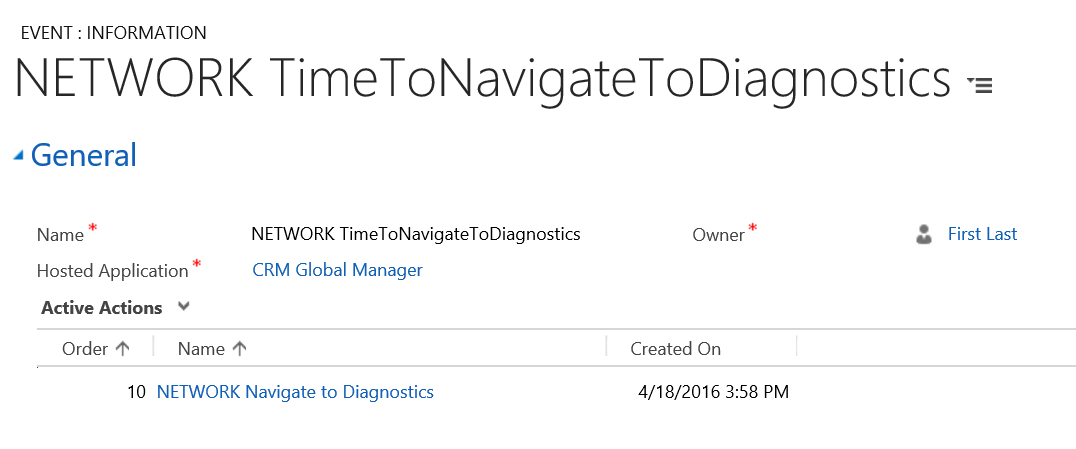
This event kicks off the "NETWORK Navigate to Diagnostics" action call.
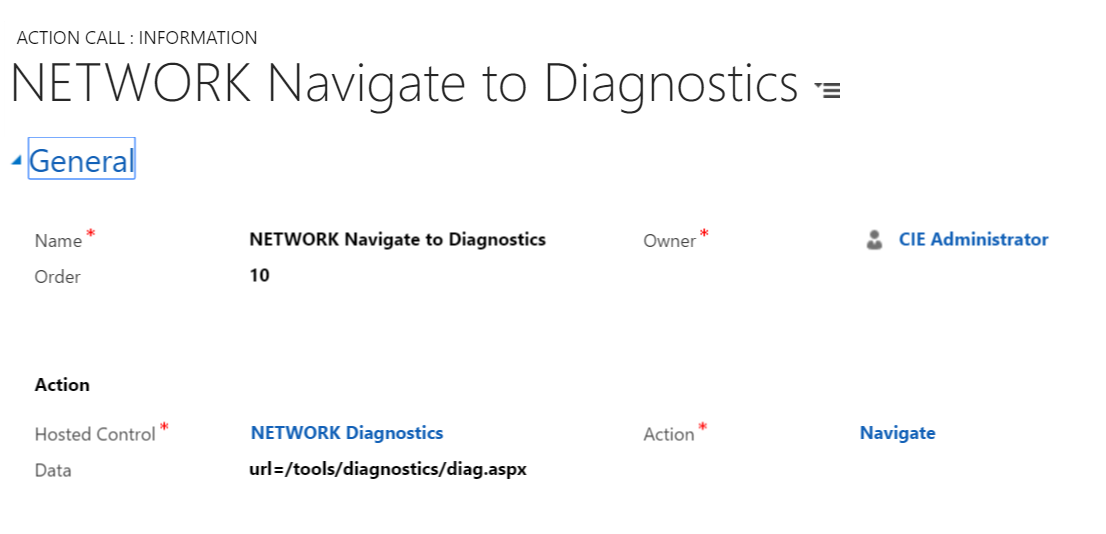
This will ultimately trigger a browserDocumentComplete event, even if the signin failed. It will then run the attached action calls.
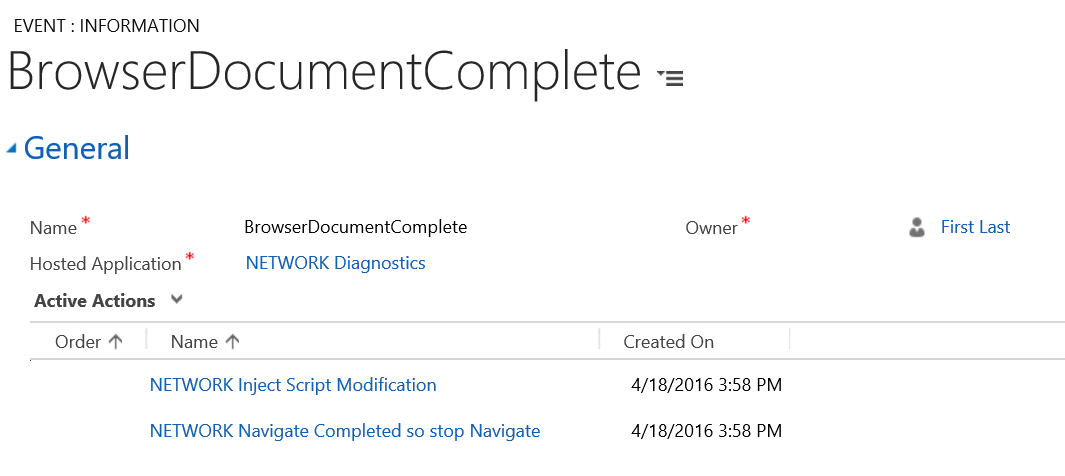
The "NETWORK Inject Script Modification" plays some tricks by injecting javascript to modifying the behavior of the Diag.aspx page so that instead of displaying the output to the screen, it will capture it for USD. The final action call, "NETWORK Navigate Completed so stop Navigate", will switch off the timer started in Global Manager's DesktopReady event if we managed to successfully reach the Diag.aspx page.
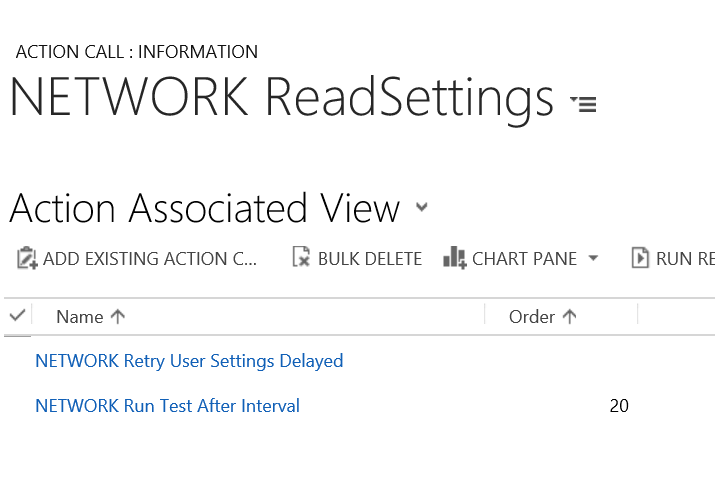
As a subaction to the NETWORK Inject Script Modification, the "NETWORK ReadSettings" action call is executed. This action call reads the User Settings from the USD configuration. Assuming this was successful, it runs it's subactions.
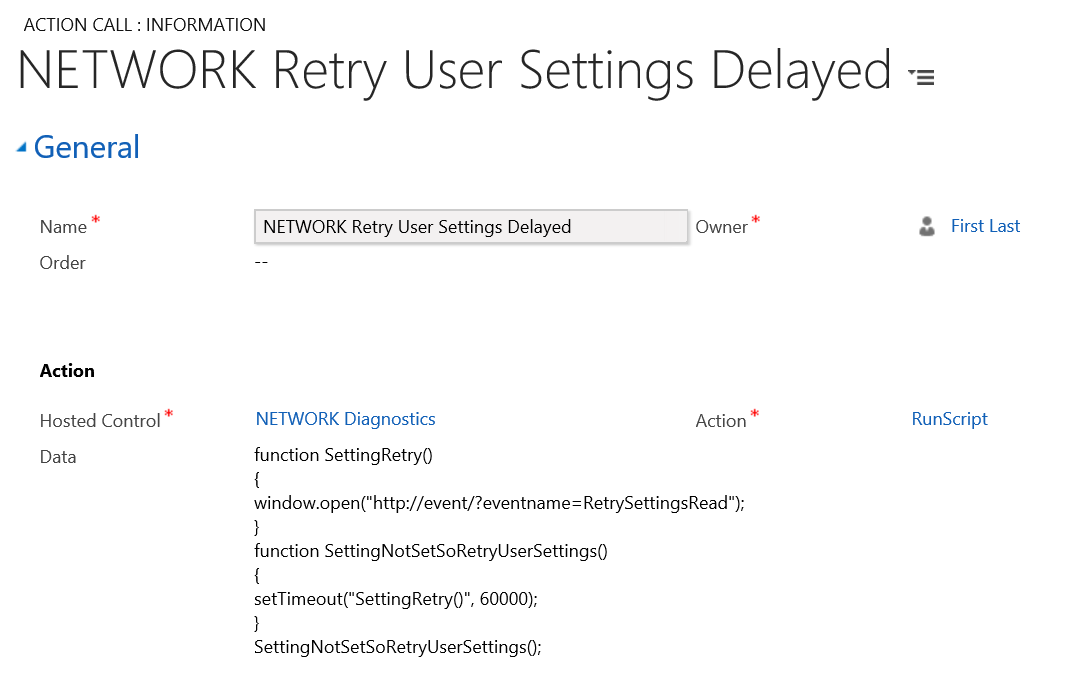
The "NETWORK Retry User Settings Delayed" has a condition that means it will only run if the DiagnosticsInterval in User Settings does NOT contain a value. This means that it will only run as a retry if the DiagnosticsInterval is not set for the user. It then injects some additional javascript into our hosted control to kick off a timer. Every 60 seconds, as you can see here, it will fire the event, "RetrySettingsRead". All this event does is call "NETWORK ReadSettings" again and start the process over again.
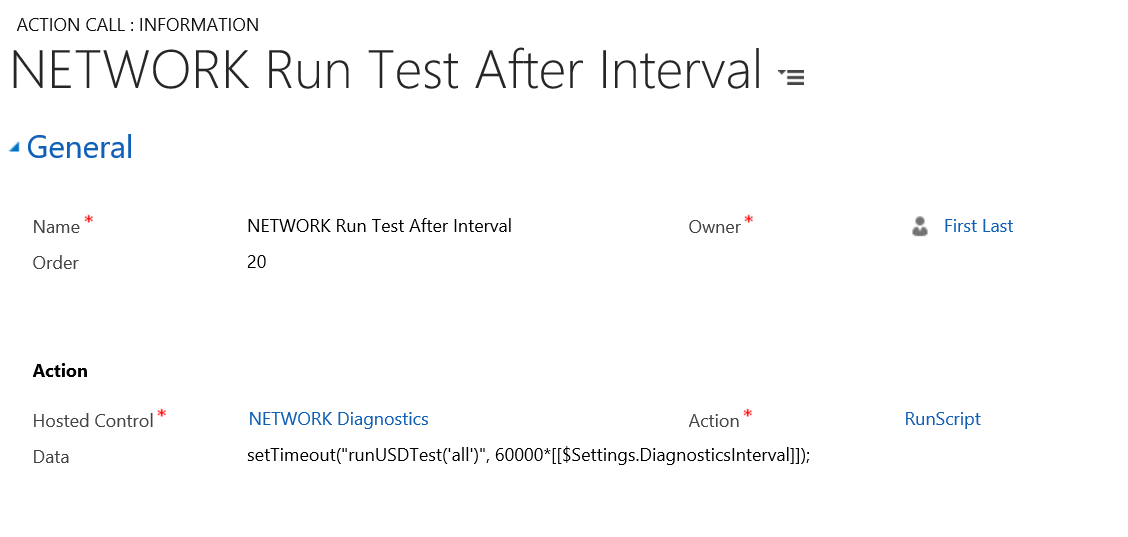
Finally the "NETWORK Run Test After Interval" is executed. It runs the previously defined runUSDTest function in the javascript. It utilizes the javascript setTimeout function to produce the delay based upon the admin's setting of the DiagnosticsInterval.
When the timer expires, the tests will be run on the webpage and in the background outside of the users view. Once the test run is completed, the TestComplete event is fired from within the javascript. This event captures the individual values out to USD's Data Parameter list.
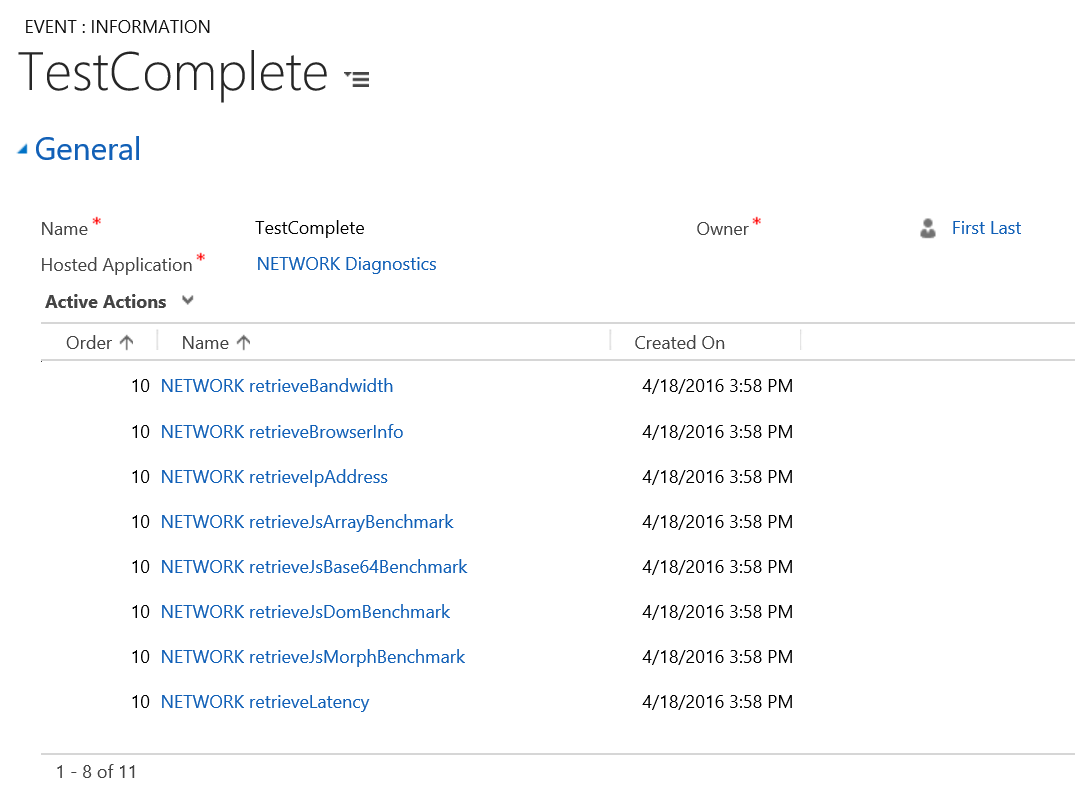
Once the values are captures off the page, USD then create an audit entry in our imported entity DiagData using the "NETWORK Create Network Audit Entry" action call.
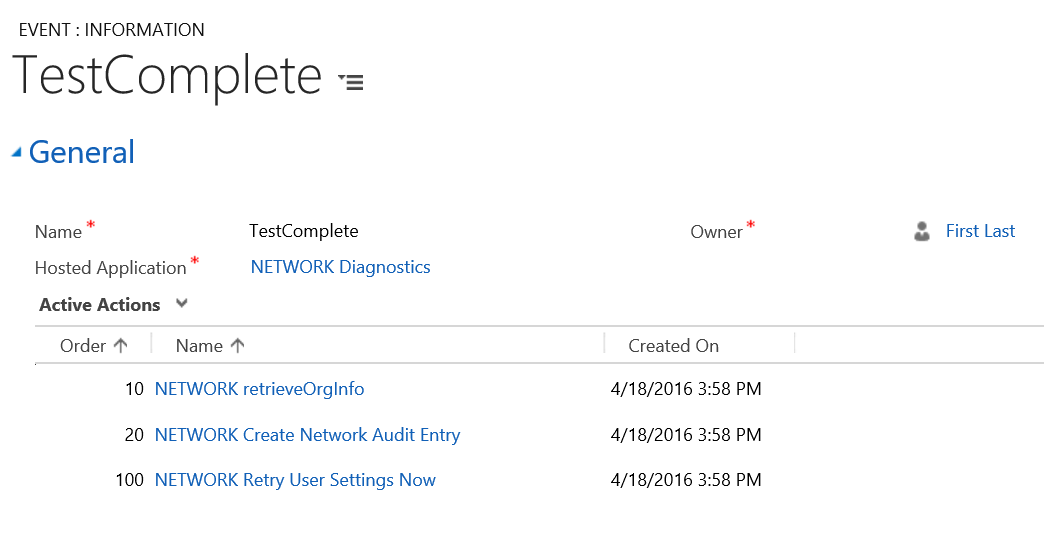
Finally, to wrap it all up, it retries the reading of the user settings immediately to see if the next pass should be scheduled for execution.
Conclusion
By taking advantage of USD presence on the desktop and utilizing it's flexible configuration system, we can add network diagnostics capture to our application without installing additional tools on the desktop. Perhaps more importantly, we can do this without user intervention and in a way that they are perhaps completely unaware that the diagnostics is occurring. The configuration above is flexible enough to capture data from specific users, perhaps those complaining that their application is slow, and at designated intervals independent of each other. This data can be viewed from the CRM web client by the admin and graphed and reported on an admin's dashboard, if desired.