Note
Access to this page requires authorization. You can try signing in or changing directories.
Access to this page requires authorization. You can try changing directories.
I’ll finish with some more examples, building on what we discussed in part 3.
SecurityEvent
| where Account has "Clive" // has is a best practise rather than contains
| project Account, Computer, EventID , EventSourceName // now I've selected a few columns of data I think are useful to reduce the noise
//or if you wanted to see a relationship between Clive and how many times that occurs you could do
SecurityEvent
| where Account has "Clive"
// now I'll selected a few columns of data I think are useful to reduce the noise
| summarize count () by Account, Computer, EventID , EventSourceName
// or Show where Clive occurs per computer over the last 7 days with intervals set to 60mins – then chart it
SecurityEvent
| where TimeGenerated > ago(7d) //set time scope to 7 days
| where Account contains "Clive"
| summarize count() by bin (TimeGenerated, 60min) , Computer // set time to 60min intervals and pivot on Computer field
| render timechart // create a timechart
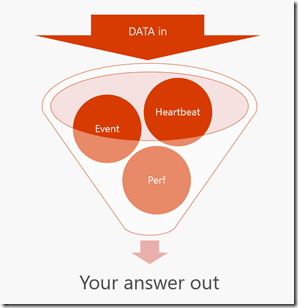
Essentially what each Log Analytics query does is reduce down a potentially massive set of data. I think of this as an inverted funnel - hopefully this diagram helps.
Its worth reading the Query Best Practise https://docs.loganalytics.io/docs/Language-Reference/Query-best-practices
A few of the DOs:
- Use time filters first. Azure Log Analytics is highly optimized to utilize time filters.
- Put filters that are expected to get rid most of the data in the beginning of the query (right after time filters)
- Check that most of your filters are appearing in the beginning of the query (before you start using 'extend')
- Prefer 'has' keyword over 'contains' when looking for full tokens. 'has' is more performant as it doesn't have to look-up for substrings.
