Power BI in Your Organisation
By Michael Robson – Technical Solution Professional (Data Platform / BI).
Since the launch of Power BI last July there's been a lot of interest and, it's fair to say, a lot of confusion as to exactly what Power BI is and where it fits.
Is it Microsoft's replacement for SSRS?
Do I need Office365?
This is really cheap; can I replace my Business Objects/Cognos investment with this?
How does it compare with Qlik/Tableau?
And so on.
You may be familiar with terms such as Polyglot Programming and Polyglot Persistence (see https://martinfowler.com/bliki/PolyglotPersistence.html for more information), which refers to the combination of different technologies to solve complex problems, whilst not relying on a single language or storage mechanism. Modern Information architectures generally refer to this concept when dealing with data from multiple sources with varying properties. We can think of this as perhaps fast moving data vs batch data, or structured vs unstructured data.
If we extend this concept of Polyglot Persistence to also include analytical and reporting tools, we could perhaps coin the phrase Polyglot Analysis or Polyglot Reporting? After all, the needs of your organisation are going to be very different depending on who is consuming information. Does the CEO want the same level of analysis from a reporting tool than an Analyst or a Data Scientist?
So let's think about who our users are and where they fit in the organization.
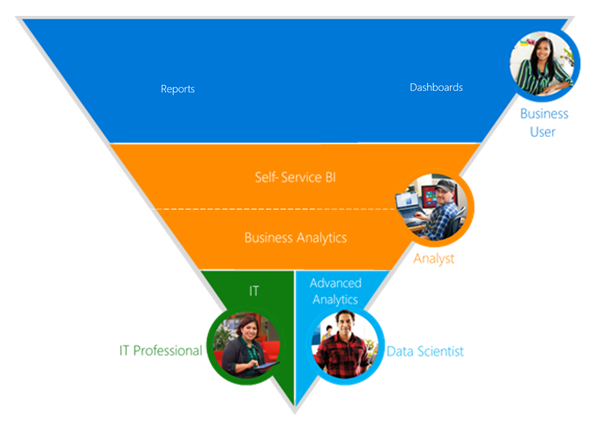
In this diagram, we can think of our users as ether consumers or producers.
Business Users
The majority of our users are going to be simply consumers. For the most part they'll have reporting delivered to them or they'll login to a portal. Consumption will be typically via static/paginated reporting deriving data from an operational system or a data warehouse. They may also demand a little more interaction via dashboards which provide some ability to search and slice data, but still within a guided environment (links and pathways through the data are defined ahead of time). Commonly, mobile reporting is also delivered to satisfy tablet and mobile users within the community.
Analyst/Super-user/Excel-Jockey
This is where we start to hit what Gartner refer to as bi-modal IT (https://www.gartner.com/it-glossary/bimodal). The super user or analyst who wants information now and they don't want to wait for IT to deliver it. We can think of this segment of users in two ways:
- Self-Service BI: Users who want to consume existing content but want to create their own reports. To deliver this IT might provide a pre-defined model (such as a Data Warehouse or Cube) and a set of tools to connect to it allowing the super-user to create their own content.
- Business Analytics: A step beyond Self-Service BI, where analysts not only want to create their own reports and visuals, but they also want to create their own models. Here, an Analyst might take data from multiple sources to create data 'mashups' in order to provide analysis for 'top-of-mind' business problems. Rather than wait for IT to build a solution to address these questions (which could take months), Business Analytics tools allow user to quickly perform ad-hoc analysis to prove/disprove a hypothesis within days, if not hours.
Data Scientist
The increased demand for Data Science skills means an increased demand for specialised tooling in this discipline. Data Scientists typically will require a set of tools that allow them to experiment with multiple models unconstrained by schemas or existing datasets.
IT
From IT's perspective, reporting tools will be focused on development and deployment tools for report creation, database/cube development, integration, planning, source control and so on.
Now that we've looked at who our users are and what types of workloads they might be running, where does Power BI fit in?
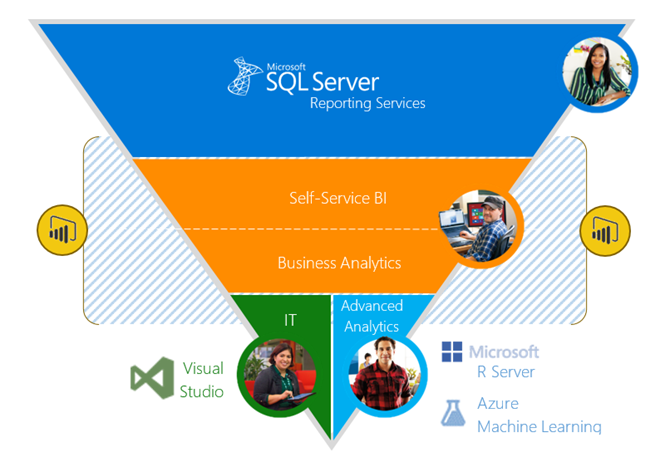
The chevron-shaded area in the enhanced diagram above shows Power BI's key user base, primarily, the Self-Service and Business Analytics community. It also shows some examples of Microsoft tooling that satisfies the other workloads. You may note, however, that the shaded area overlaps all users to some extent. This is simply because there are feature overlaps. Let's explore this a little.
Power BI for Reporting and Dashboards
Just like SSRS, Power BI can be used to create rich dashboards and reports. Unlike SSRS, Power BI tends to be not so granular. With SSRS, the developer can open up detailed scripting and formatting to control the navigation path between reports as well as detailed pagination options such as defining margins and so on. Power BI adopts a more drag-and-drop approach, with the focus on obtaining insight from the data through interactive visualisation, not scripting pixel perfect dashboards.
Power BI for the Data Scientist
I'm not claiming that Power BI can replace a wealth of tools and languages being used by Data Scientists, but there are a couple of key areas where it can significantly accelerate the value Data Scientists can bring to the rest of the organisation. For example, native integration with
- R as a data source, allowing you to import the content of data frames, and
- R visuals, allowing you to embed native R visuals directly into a Power BI report or dashboard
will allow data scientists to quickly produce and share insights with the business community without the need for complex database integration.
Power BI for IT
A key use case for Power BI for the IT organisation is rapid prototyping. The underlying technology behind Power BI is SQL Server Analysis Server's tabular engine, allowing IT to produce prototypes using familiar enterprise capabilities. These prototypes could be rapidly developed and shared with the business community to gain feedback, and then, if required, they can be imported into SQL Server. As with the Data Science use case, this could be developed without the need for large infrastructure to be deployed or changed. Once value has been proven to the business, more formal models can be deployed using SQL Server Analysis Services, Azure Machine Learning, and R Server, and necessary integration pipelines built.
Conclusion
At a high-level, this illustrates where the various BI and Analytics technologies fit into an organisation and what workloads are best suited. Power BI fits into the Self-Service and Business Analytics field well, spanning the spectrum and providing a broad set of tools for your organisation. However, consider the end user and the outcomes they are trying to achieve. It may well be that in order to achieve the outcomes your organisation needs you need to use a number of different reporting tools.