Showing the effects of insulin on a liver cell using Bio Model Analyzer
Guest post by Audrey Adeline Microsoft Student Partner at Cambridge University
Hello! My name is Audrey and I am a first year undergraduate reading Natural Sciences at University of Cambridge this year. I am passionate about science and technology, especially on how it can help to improve other people’s lives. Perhaps just like you, I do not come from a technical background and I hope that by the end of this article I am able to convince you that you too can use technology to make your life a little bit easier.
LinkedIn profile: https://www.linkedin.com/in/audrey-adeline-44678b148
Introduction
In this article, I am going to guide you through a step-by-step process on how to use BioModelAnalyzer. Bio Model Analyzer is an online tool that allows you to build and simulate the internal mechanisms of cells and how they interact with each other. With it, you can check how changing certain features of the cell affect its stability through pre-programmed analysis. The tool is designed for people with little to no technical knowledge, so don’t worry if you don’t have any prior knowledge in computing!
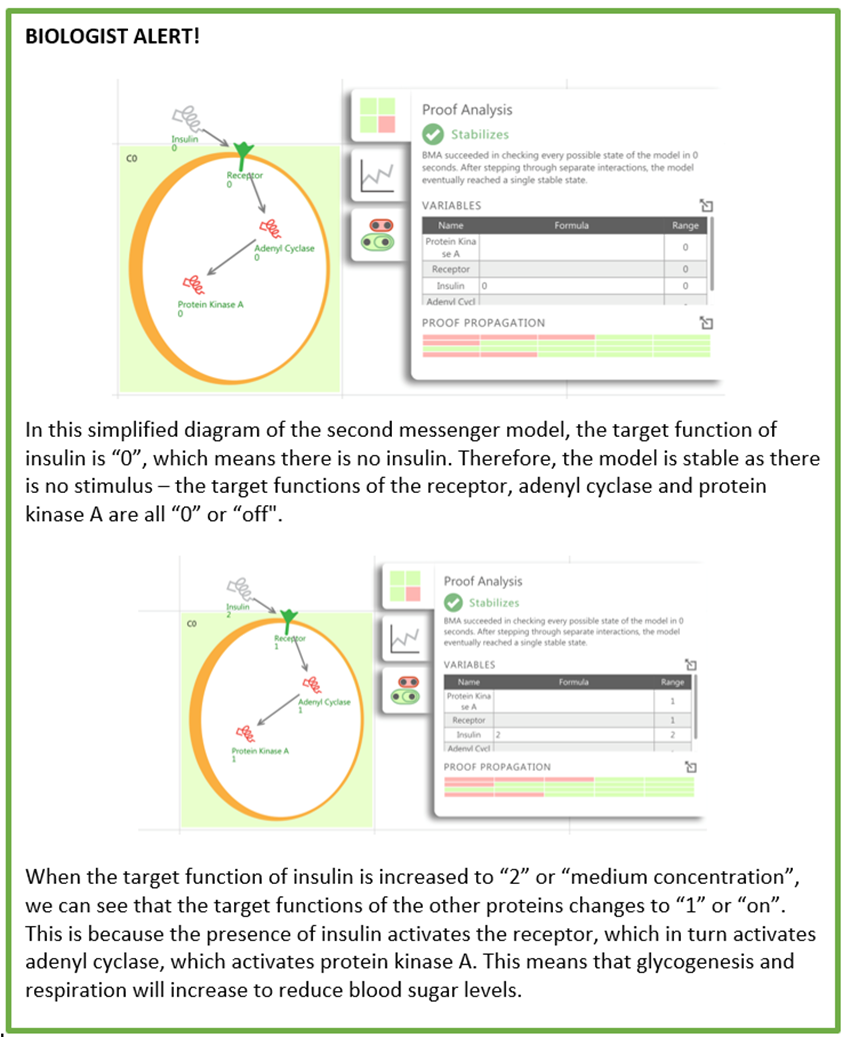
If you are a biologist, you can look out for the green “BIOLOGIST ALERT!” boxes showing an example on how to build a simple liver cell that shows how the second messenger model works when insulin is present in their surroundings. By the end of this tutorial, you will be able to:
· Build a model using BioModelAnalyzer
· Assign names and ranges to the variables in/around the cell
· Apply target functions to variables
· Check whether a model is stable
Accessing BioModelAnalyzer
To access BioModelAnalyzer, follow this link: https://biomodelanalyzer.org. Once you have opened the page, click “Launch Tool” to begin.
Building a Model
1) Naming your model
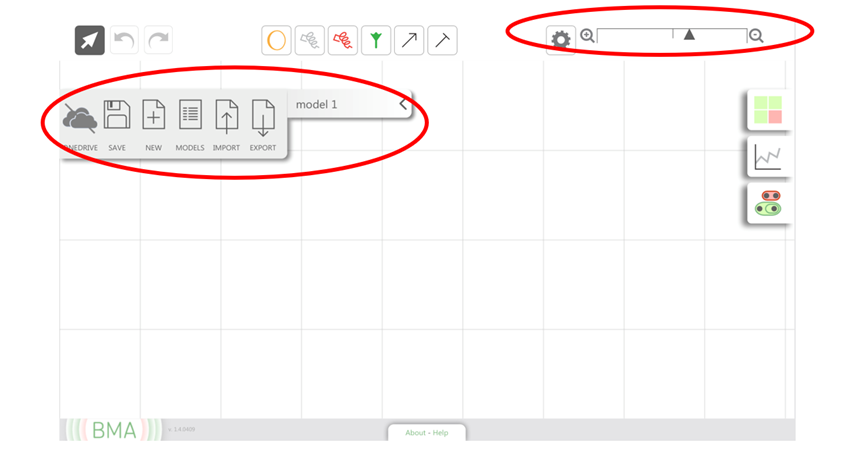
You can rename your model by clicking “model 1” on the left hand side and typing in your model name. If you click the arrow head next to it, you can also see options to save, create, browse, import and export your models. You can also zoom in and out using the panel on the top right corner.
2) Adding cells and variables
You can add new cells and variables by dragging them into the grid from the top bar. The figure below explains the meaning of each symbol:

Once you have clicked the icon, you can add as many cells and variables as you’d like by simply clicking where you want it to be.
3) Adding relationships
Similarly, you can add relationships by clicking the arrows and dragging them from one variable to another.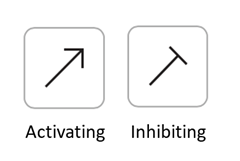
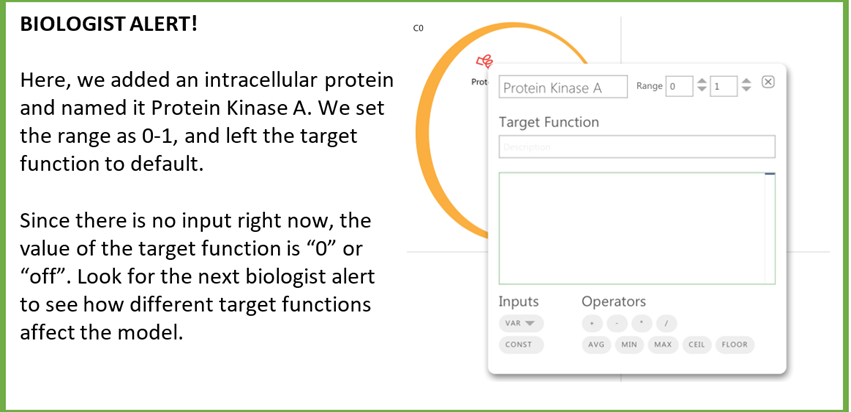
4) Naming and adding ranges to variables
Before you do this, make sure you are on the selection tool mode by clicking the mouse sign on the top left corner. When you click a cell or variable you have added, a dialogue box should appear. Here you can give them a name and descriptive ranges. Some common descriptive ranges are listed below:
5) Target functions
The default target function is given as  . You can set the target function in the same dialogue box as before.
Analysing the Model
1) Proof Analysis
You can check whether a model will eventually return to a stable state by clicking the proof analysis button ( ).
).
2) Simulation Graph
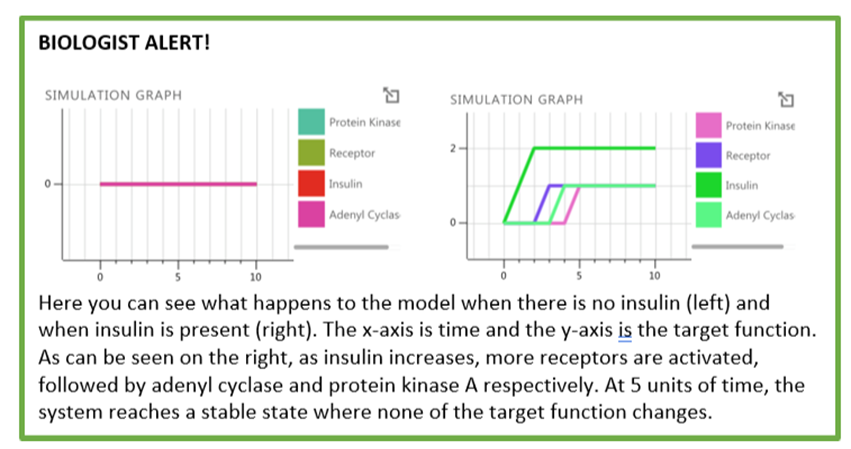
You can also look at the simulation graph by clicking the button. 
3) LTL Analysis
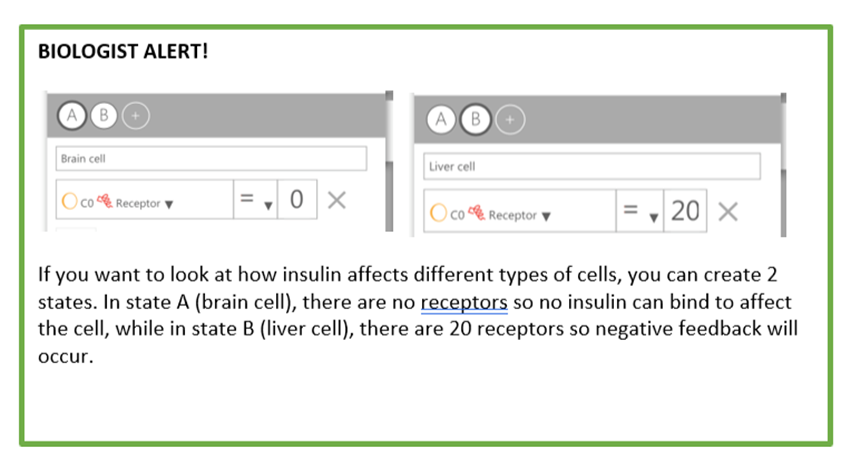
The  button opens the LTL analysis tab. This allows to add special behaviours to the proteins in the model. You can define different states of the proteins to see how they affect the model in the “STATES” section. You can determine which protein you would like to change by clicking the intracellular protein button and you can change its properties by altering the symbol and number columns. To add a new state, click the “+” button on the top bar of the panel.
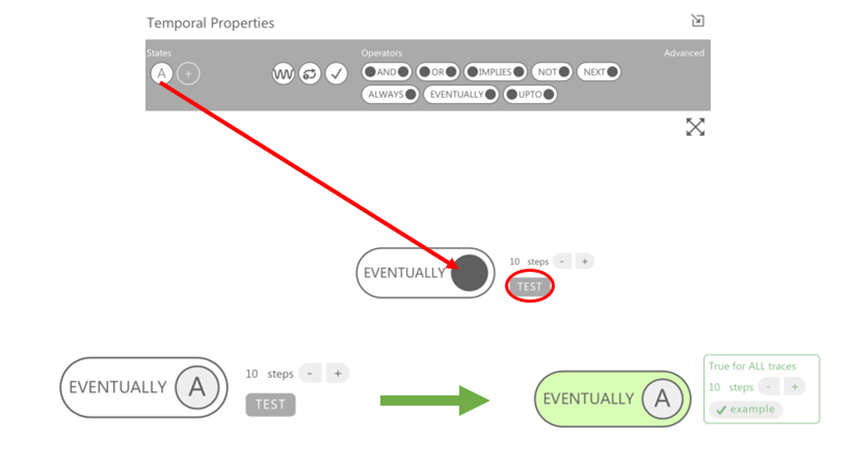
You can also add “TEMPORAL PROPERTIES”, which gives a time property to the states of variables you have previously defined. For example, you may want a protein to be activated for a certain time before returning to an inactive state. To do this, you can drag the “eventually” operator to the screen and drag a state into the empty hole, choose the number of steps before you want it to return to an inactive state and press test. An analysis should appear to show whether it has a stable endpoint (green) or ends in oscillations (red).
Conclusion
Congratulations! You can now use the BioModelAnalyzer to create and analyse cellular models of your own. You can create more complicated models by having multiple cells interacting with each other and comparing more states and temporal properties. Thank you for following my blog post and I hope it has helped you to gain more confidence in using the BMA!
Links and Other Resources
For further information and examples you can access:
· The BioModelAnalyzer help page: https://biomodelanalyzer.org/help.html
· Introduction to BMA video: https://www.youtube.com/watch?v=RDefcGkXJXk
· Example of BMA model: https://www.youtube.com/watch?v=MRMCr0dWD5c
· Computer Aided Verification (BMA guidebook - pdf): https://www.microsoft.com/en-us/research/publication/bio-model-analyzer-visual-tool-for-modeling-and-analysis-of-biological-networks/

