R is fun & easy with R Tools for Visual Studio (RTVS)
Guest post by Gorata Ramokapane, Microsoft Student Partner
I’m a second-year student in University College London pursuing a degree in Statistics, Economics and Finance. In my first year of university I completed a module that basically introduced me to programming using R specifically on Rstudio. This further nourished my interest in data science. Recently, I have had an opportunity to explore R tools for visual studio (RTVS) which is the focus for this article.
In this blog post, I will be showing how one can import data, plot histograms and remove wrong data entries. Working with plots is one aspect of data science that all data scientist have to experience. Analysing and presenting data is very useful to science and innovation.
In this tutorial, I will also be discussing some useful tips and advantages of using RTVS to analyse data. If you are new to RTVS this is just perfect for you. By the end of this post, you would be plotting histograms with confidence with the help of RTVS. I will conclude the blog post by discussing some of the features of plot windows then give you additional advantages of using RTVS.
Preliminaries
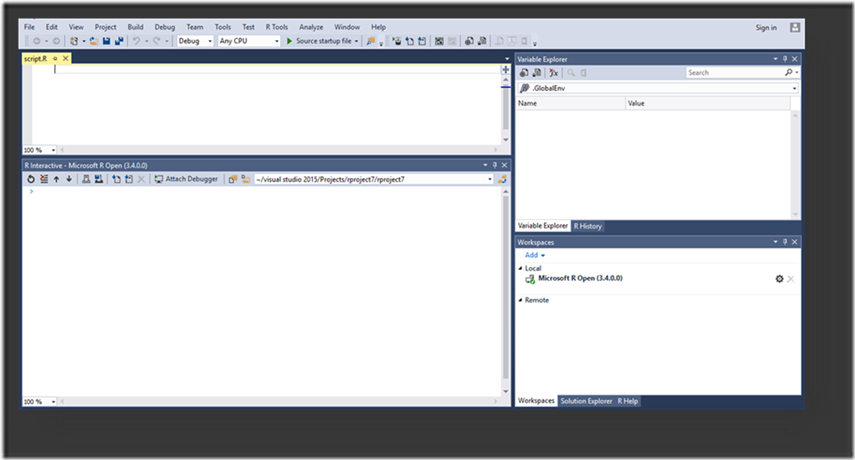
· Make sure you have installed RTVS with all the required tools like the R interpreter.
· Create a new project
Part 1: PLOTTING HISTOGRAM
To demonstrate how RTVS handles plots, I will be using a sample data that is nicknamed ‘qanda’. Qanda contains basic information about people’s lives e.g. number of siblings and height. The complied data will be saved in a file called “selective_affinities” and can be found in my project workspace. Selective_affinities is a csv file.
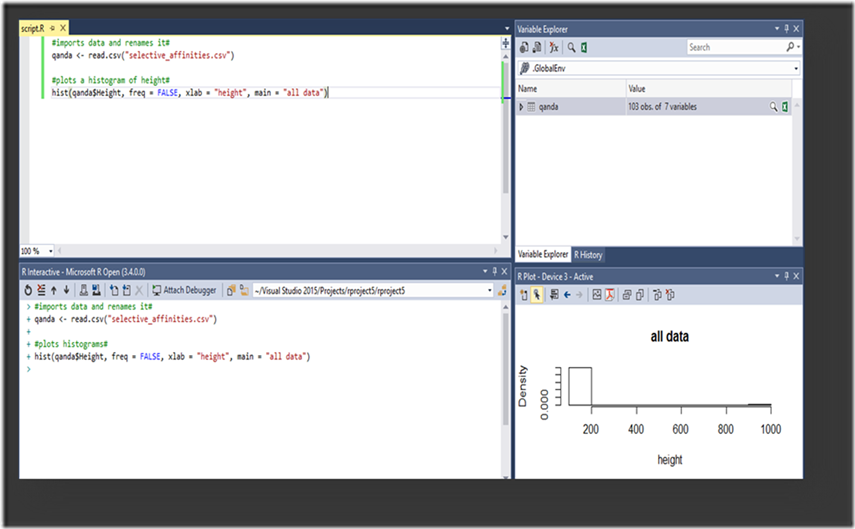
First, we will start by importing this data and saving it in our project and naming it qanda. To do this, we will use function read.csv() which will allow us to read any csv file. See the screenshot below.
Code snippet:
qanda <- read.csv(“selective_affinities”)
After importing data into qanda, the next step is to use the function hist() to plot our histogram. In our case, we will be plotting height from our qanda object.
Code snippet:
 hist(qanda$Height, freq = FALSE, xlab = “height”, main = “all data”)
 hist()
FUNCTION EXPLAINED.
qanda$Height: This specifies which column of data should be plotted. We are plotting the data in the height column.
Freq: This specifies whether density or frequency should be plotted. In our case, we want to plot density therefore we specify this by passing FALSE to this argument.
Xlab: This specifies the label for the x-axis of the plot. Since we are plotting data related to height we can just label this ‘Height’.
Main: This specifies the title for the plot.
Note: RTVS has an intelliSense which is a very powerful tool. It allows auto-completion and it gives hints on functions. For example, it gives you the name of the function, the arguments of the function and what the function is about. (See screenshot: Grey box showing information about hist() function.) intelliSense will give you confidence in what you are doing, knowing that you are using functions the way they are supposed to be used.
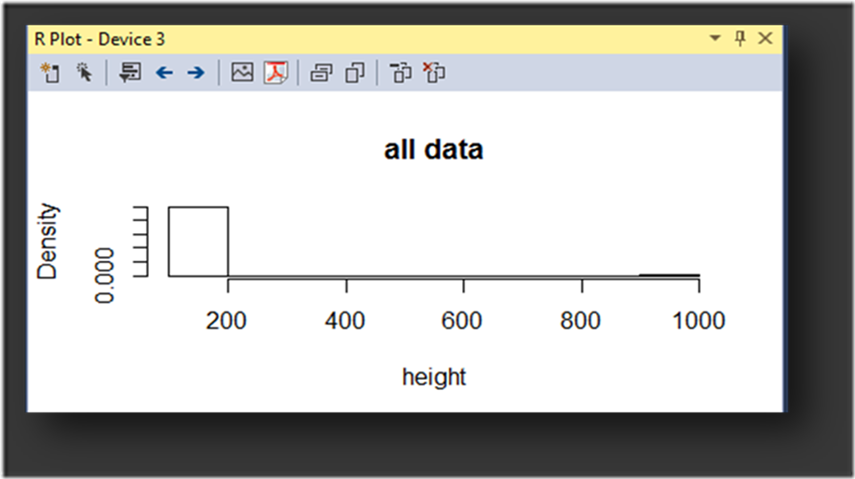
Running our script creates some activity in the interactive box and opens a window showing our histogram. The histogram produced can be found in the window at the bottom right corner of our screen. (See screenshot below.)
Discussion of the results:
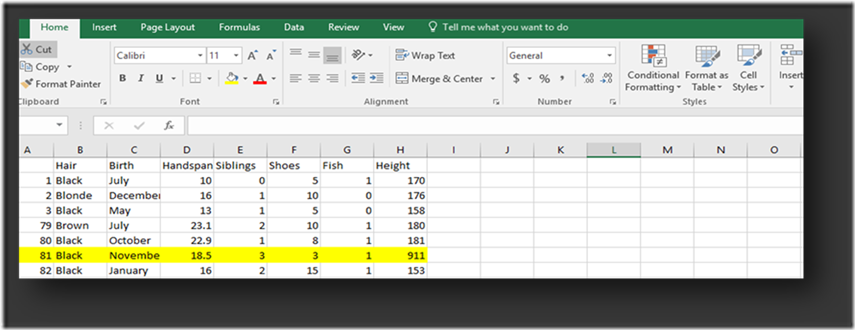
Our histogram shows the presence of an erroneous response because height as a measurement should have a relative normal distribution. Now this is where we take advantage of RTVS, using RTVS we are able to export this data to excel or any software that can view our data source. After opening this in excel we can now see which data entry is wrong or causing the error. In our case, we have found out that row 81 to be the one with erroneous height entry.
To fix this error or remove the entry with error, we will do the following.
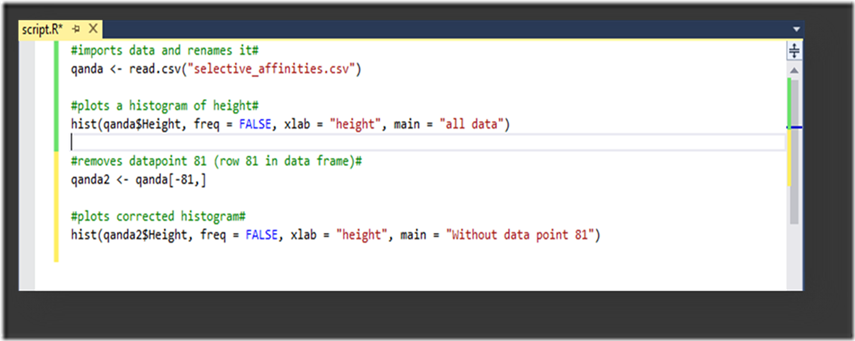
We remove entry number 81 and then store the new data set in qanda2.
Code snippet:
Qanda2 -> qanda[-81,]
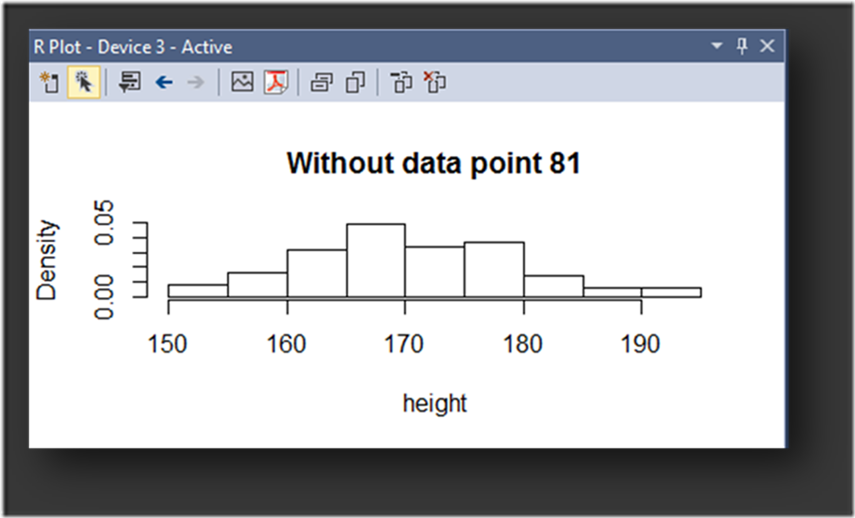
After successfully removing the entry with the errors, we run the hist() function again.
Note: It is a good practice to have comments on your scripts. This allows other people to know what you have done or tried to achieve. Comments are also useful when debugging your code; you are able to easily see what you have done. Remember to put the hash or pound sign “[#]”, RTVS compiler will ignore everything that’s written after a hash or pound sign.
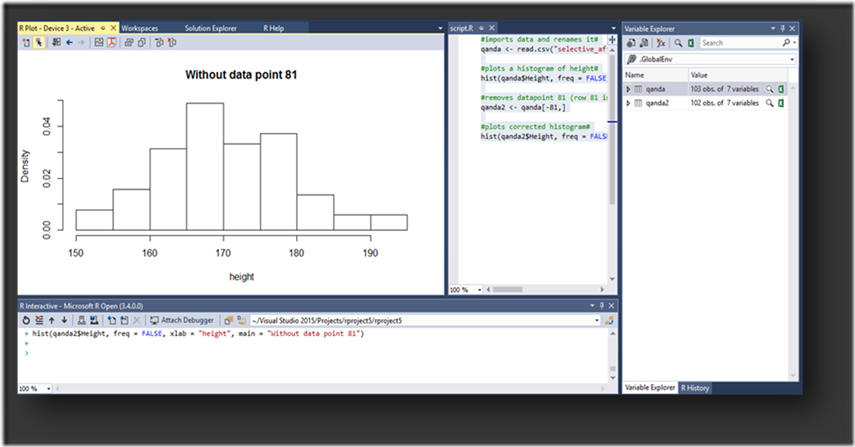
NOTE: With RTVS, the script window is able to show you which part of your scripts are saved and which ones are not. By default, it uses the green and yellow vertical lines on the left of your code to show the saved and unsaved lines of code respectively. (See the screenshot below)
After running our scripts we now get two (2) histograms, the one with the error data entry and a nice looking histogram without the error. Seeing both of them side by side gives us a chance to compare them and show their differences. (See the screenshot below)
Part 2: EXPLORING RTVS PLOT WINDOW
In this section, I want to take some time and discuss some of the features of the RTVS plot window. They are as follows:
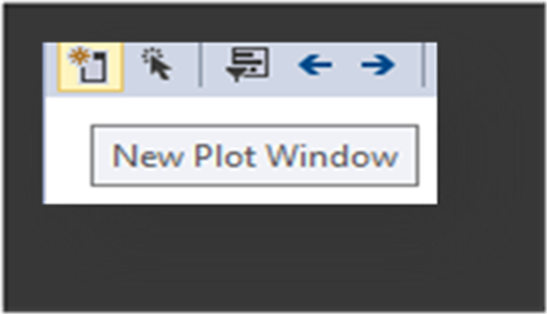
1. New plotting window
With RTVS a new plotting window is just a click away, any plot commands run thereafter appear on this window. This can be very useful when working with multiple plots during data analysis.
2. Total control of window
Another feature that is very useful is the ability to drag or move windows around. The window can be moved/ dragged around the screen and placed at any desired position. It can also be resized (enlarged or shrunk) to satisfy user’s different needs.
3. Multiple plots in one window
There are times when you have multiple plots but having them in a single window is important. RTVS allows you to do that without any problem.
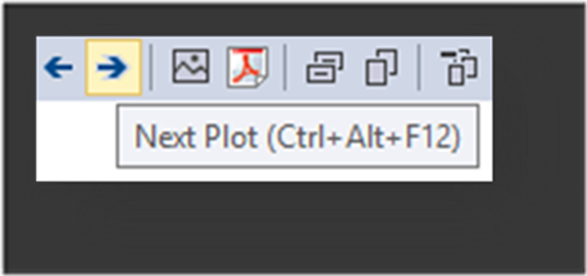
Icons are used to scroll through plots in the active window.
4. Saving plots
Another powerful feature of RTVS is the ability to save plots seamlessly in different formats. With plot windows, one can easily save their plots as either PDF or an image (png, jpg, bpm and tif). This is useful for presentations and report writing.
Plot images can immediately be save as a pdf using the dimensions of the current window size. This allows a person to save their plots in any size.
5. Removing and Clearing plots
RTVS allows you to clear your plots in two ways. The first option allows you to clear a plot that is currently displayed on the window and the second option is to clear all plots in the active window from the history all at once.
6. Plot history
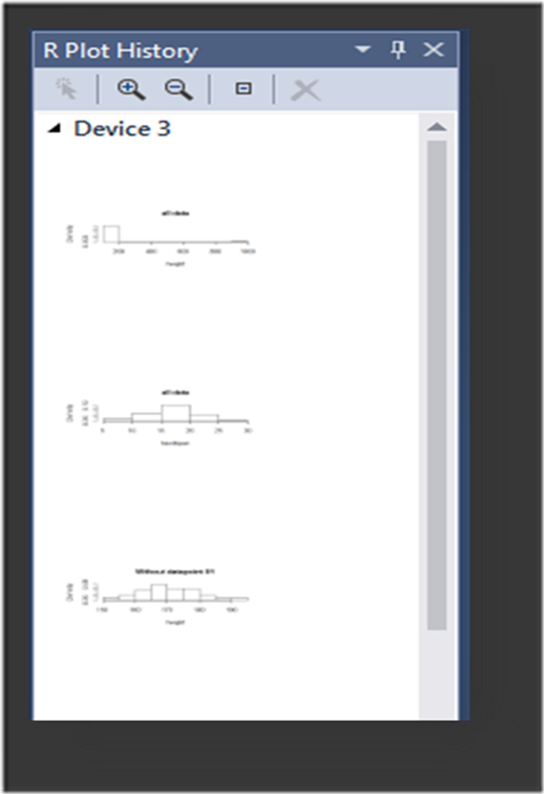
Another useful feature is the plot history. We all have made that mistake of closing a plot that we still need. But with this, we are able to see our previously plotted graphs and can open them whenever we need them.
Click this history symbol to open history window. A window will pop out and showing all the plots generated in that session as thumbnails.
MORE ADVANTAGES
In addition to all of this the following are some of the other good reasons every user should consider using RTVS
· RTVS is free but gives you more control and features. You just need to download visual studio community version which is free from Microsoft visual studio website. (Visual studio Community version)
· RTVS allows connection to Azure (Microsoft Cloud) to process bigger data sets without any problem.
· With RTVS one can switch from a local to a remote workspace which allows creating code easily using small data sets (development environment) and later using them for bigger data sets (Production environment).
· RTVS also has an icon that easily attaches a debugger and allows all commands in the interactive window to be run under the debugger. This helps in correcting code as the user goes along.
· Possibilities with RTVS are endless.
RESOURCES
https://www.visualstudio.com/vs/rtvs/
https://blogs.msdn.microsoft.com/visualstudio/2016/03/22/introducing-r-tools-for-visual-studio-3/
