Data science in 5 steps with Microsoft Azure Machine Learning
Cats vs Dogs a guest post by Microsoft Student Partner, Lars Hulstaert from the University of Cambridge.

Lars is current studying for an MPhil in Advanced Computer Science (focussed on Natural Language Processing and Machine Learning)
Introduction
Data science and machine learning are hot topic nowadays. Getting insights in vast amounts of data allows us to learn and discover valuable information, by examining data that is often already present. More so, companies in all industries, are interested and eager to leverage their data to gain more insight in their business and perform better.
The idea of magically deriving valuable insights from large amounts of data sounds fascinating and appealing. A lot of people I have met however, feel less enchanted by the fact that to learn more about data science, a rather solid programming background is required.
What is needed, is a platform that allows them to experiment and gradually learn more about data science and machine learning. As you might have guessed from the title, this is exactly the promise that Microsoft Azure brings with their Machine Learning platform.
As Microsoft states on their website, Microsoft Azure Machine Learning is ‘Powerful cloud based analytics’ and ‘Simple, scalable, cutting edge’. What this basically boils down to is the following:
-The Azure ML platform is cloud based, meaning that you don’t have to install any software on your device. No fiddling and messing with software installations, everything is available for you, through your favourite browser.
-The Azure ML platform is simple in concept: it was designed and developed for applied machine learning. More specifically, the platform allows you to discover and experiment with data science and machine learning tools in a simple drag-and-drop interface. No need to become a code ninja or have any coding experience when taking your first dive into the fascinating world of data science.
- The Azure ML platform is cutting edge technology for everyone : you can start of using existing datasets and algorithms that are already implemented. You can easily expand on the system to suit your needs and make it more expressive by developing different modules for it. The platform caters for beginners, as well as experts.
- The ML Azure platform is scalable:
start of running a small experiment, and deploy your experiment into production as a web service in minutes. The platform allows you to run small trials, but more resources are always available through Azure.
This all sounds great, you might say, but how do you start experimenting?
In the remainder of this blog I will go over each of the steps required to run your very own, first experiment. As with every introduction, it is important to cater to everyone’s needs and interests, which is why I decided to run an experiment on ‘cats vs. dogs’.
The idea of the experiment is very simple:
You have a large set of pictures of cats and dogs (25000 to be precise). The goal of the experiment is to create a classifier, that automatically distinguishes between cats and dogs, by ‘learning’ from the available labelled images. After the classifier is ‘trained’ on all our pictures, we could use it to automatically classify e.g. the cat-dog images on a smartphone.
While this experiment uses a toy setup to explain the basic principles behind the Microsoft Azure ML platform, it can easily be expanded to more advanced problems, such as sentiment classification of tweets, energy demand forecast, to name a few. If you want more in-depth tutorials on the Azure platform, be sure to look on https://gallery.cortanaintelligence.com/, where a community of data scientists and developers share their analytic solutions.
Cats vs. dogs
Step 1.
Sign up at https://studio.azureml.net/, for free access to the Microsoft Azure Machine Learning Studio. The Machine Learning Studio is available from every browser, and provides you with free storage and the necessary tools to start.

The platform is free and open for anybody to try. Sign up using your email, no credit card is required.
Step 2.

Arriving in the Studio, you will see different tabs. In this blog we will focus on projects and experiments. Web services allow you to deploy your model to a web service (e.g. if you want to use your cats vs. dogs classifier in your app or website).
With notebooks, you can write up modules for your experiment, or completely code your entire classification system and run it in the cloud. Notebooks can be written in Python or R, whichever you are most comfortable with. The datasets section contains the different datasets you can use. For experiments, you can upload your own data set, or use an existing one, to experiment. Finally, trained models can be used to save the models that you have trained in experiments.
I have already gone forward and created a project. I added the Cats vs. dogs dataset and an empty experiment to the project.
Dataset
Whenever you plan to experiment in the Machine Learning Studio, you will obviously need a dataset to play with. You can use existing datasets (e.g. images of handwritten numbers for a classification experiment, tweets for sentiment analysis). I decided to upload my own dataset, as the Machine Learning Studio did not yet have a Cats vs. dogs dataset (a real shame if you ask me!). The dataset I am using is actually from the Dogs vs. Cats competition on Kaggle (https://www.kaggle.com/c/dogs-vs-cats). In this experiment however, instead of using the pictures, I decided to use the dataset in a slightly different format.
Data pre-processing
A standard practice in data science, is to represent the dataset in a standard/general format. The idea of data science is to reuse techniques and models as often as possible (its ease-of-use, not laziness). Using a general format is one way of achieving this.
Often this format is the CSV format (comma separated values). For example, in the case of images, instead of representing each picture as a large 2D array of pixels, it is converted to a long a 1D array of pixels.
Each pixel in an image has a value between 0 and 255, representing the intensity of that pixel. While each pixel has a corresponding R(ed), G(reen), B(lue) pixel, in this experiment we worked with images converted to grayscale. Obviously, using colour information will greatly improve the results, but using a simpler image representation (gray scale) is computationally less intensive.
As a result, the image dataset I use, is converted into a CSV file, where each line of the CSV, contains a list of comma separated pixel values. As we still need to be able to distinguish between ‘cat and dog rows’ in the file, we prepend a zero in front of the cat rows, and a 1 in front of the dog rows.
This approach seems good, but it would result in rows of different lengths. Later we will see why this gives problem when feeding the data into the model (the model we will use works on fixed length data). We thus rescale each picture so that they all have fixed dimensions. (50x50 pixels).
Let’s go over the steps we have thus done so far for each image (no code as promised):
1. Read the image, convert it to grayscale, and rescale it to 50x50.
2. Convert the 50x50 pixel values to a 2500 value row and append the class label in front.
This pre-processing can be done in a Notebook on the platform, or you can simply look for datasets that are already in the good format.


0, 24, 14, …
class, feature1, feature2,
(source : https://www.vetprofessionals.com/catprofessional/images/home-cat.jpg)
The result is a CSV file of 25000 rows, each row containing the label first (0 or 1), and 2500 pixel values, separated by a comma
The process of converting the data from its existing format (e.g. images, text,…), to a general format that is amenable for the system down the line is called data pre-processing.
Often pre-processing is more complex and will transform the data to make it useable in the system. The basic idea of using machine learning techniques, is that pre-processing turns the data from a specific into a general format. Once the data is in a general format, consisting of a label (image class in this case) and features (pixel values in this case), the data can be used in machine learning (ML) techniques. The basic idea behind pre-processing is that you end up with a representation that is independent of the problem that you intend to solve. Whether you want to classify pictures, classify customers or documents, the idea is that after pre-processing, a general ML algorithm can be used to solve it. The specific algorithm that will work best will of course depend on the problem at hand, but by using pre-processing, a general class of approaches will be available.
Truth be told, the Machine Learning Studio can do all this for you, using the Image Modules, but hey, what a great introduction to data pre-processing, was it, not?
Step 3.
Now we will start adding the different components together to create the experiment. This can all be done by selecting components and using drag and drop to combine them.

First we add the Cats vs. Dogs dataset to the experiment. The dataset can be selected in the dropdown menu and dragged onto the experiment slate.
Step 4.
Next we will setup the experiment. The idea is that after this process, the experiment looks like the following picture.

I will go through each step and component.
Add an ‘Edit metadata’ block to the experiment and connect it with the data. This metadata block will allow us to tell the system which column contains the labels of the data (the first one in our case), and which columns contain the features (the raw pixel values in our case).
Next a ‘Split Data’ is added. This will split our data randomly into a 80-20 split. 80% of the pictures are used for training of the model and 20% of the pictures is used for testing the model. The idea of splitting the data, is that we want to be able to test our model on unseen data. If we would train and test our model on the same data, we would most likely end up with a model that performs very good. The model will learn the specific data we trained on it, instead of learning generalizable properties from the data (e.g. learn the specific shape of dog and cat heads, or their typical colours). Splitting the data, allows us to train the model on one set of pictures, and verify later on unseen data.
As the dataset is in a general format, a machine learning technique can be used to solve the problem. In the case of a classification problem, the model should classify an image, based on the features (the row of pixel values). Basically, the model learns how the different features interact for the different classes, and how based on this interaction, the class can be derived.
In our case, we skipped one step between data pre-processing and fitting the data to a model. Normally, feature engineering is performed after pre-processing. In case of feature engineering, the data from the pre-processing step (e.g. the pixel values), is transformed so that its discriminative power increases. Based only on the pixel values, a human or a computer would have a hard time deciding the class. It would be for example interesting for the computer to know which different colours are present in the picture, and where (as cats and dogs differ in colour). Or it might also be interesting for the computer to know which shapes are present in the images (as cats and dogs differ in shape). In this experiment however, we will not perform feature engineering (as it is often quite a tedious process). In this experiment we will use a neural network, a model that is able to extract interesting features, based on the raw data.
For this purpose, we add model block to the experiment. In this experiment we decide to go with the ‘two-class neural network’ . I won’t go into the details of the model, as there are plenty of tutorials online explaining neural networks (https://gallery.cortanaintelligence.com/Experiment/Neural-Network-Convolution-and-pooling-deep-net-2).

https://neuralnetworksanddeeplearning.com/images/tikz1.png
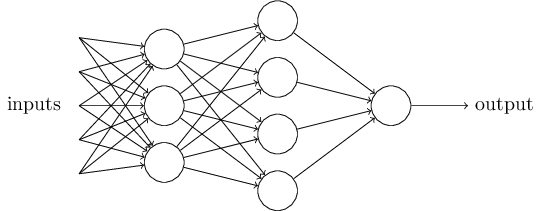
Basically, one interpretation is that the neural network learns different filters, which it overlays over the picture. Imagine a general dog shape, being overlaid over an image. In case the picture is an actual dog picture, the filter will correlate highly with the picture, yet an image of a cat, will not correlate very highly. Based on the combination of multiple complex filters, the model will be able to decide which class is present in the image. The model itself, will learn these filters, by seeing a lot of data, and iteratively improving the filters so that it is able to distinguish between different classes.
Having the model block in place, we add a ‘Train Model’ block. We connect the train data and the model with this element, which is necessary to train the model on the train data. After the model is trained, we want to be able to score its performance, based on the model parameters we have just learned (in the case of a neural net, these are the filters).
Next, two ‘Score Models’ blocks are added to the experiment. Model scoring is evaluating the model on a dataset (once on the train and once on the test set).
Finally, adding the ‘Evaluate Model’ block, will allow us to compare the accuracies on the train and test set, and investigate how the model has performed.
Step 5.
We run the experiment, which takes about 15 minutes, to train the model on the images. The performance on the train set 79%, and on the test set it is 72%. While this is not the highest one can possible achieve (state of the art cat-vs dog models achieve 95% accuracy on the dataset), I invite you to play with the different configurations of the model, and try to reason why one option works better than the other.
In the past 5 steps, we have gone over some important key concepts when solving tackling a data science problem. An experiment often starts with gathering the data and pre-processing it. Subsequently, feature engineering is performed to extract the important features from the data (not done here). Finally, having prepared the data, a model is trained and evaluated.
Conclusions
As mentioned in the beginning, this data comes from one of the Kaggle project, where different teams competed to achieve the highest accuracy on the dataset.
Microsoft Researchers have expanded on this work, and developed project what-ProjectRobot (https://www.what-dog.net/ ).
This project focuses on a more difficult problem of determining the kind of dog that is present in the picture.
This work is based on their cognitive services tooling https://aka.ms/cognitive.
If you are interested in machine learning and data science and want to learn about it, I definitely recommend you to discover the other features the Microsoft Azure ML platform has to offer.